Stock Analysis · Roivant Sciences Ltd (ROIV)
Overview
Roivant Sciences Ltd is a biotechnology company that builds, funds, and develops drug-focused subsidiaries. Its model is different from a traditional single-product drugmaker: instead of relying on one main research platform or one large commercial franchise, Roivant creates or acquires programs and advances them through clinical development, often through separate “Vants” dedicated to specific medicines or therapeutic areas. The company’s current focus is centered on innovative medicines in areas such as immunology and other specialty indications, with a pipeline that is still development-heavy rather than broadly commercialized.
That business model means Roivant’s economics can look unusual. Revenue is not mainly driven by a stable stream of medicine sales today. Instead, it has historically depended on collaboration payments, licensing arrangements, service and technology-related income, and gains tied to strategic transactions or changes in the value of subsidiaries and investments. This creates more variability than at mature pharmaceutical companies.
Based on recent filings and the company’s structure, the main economic sources are best understood as follows:
- Collaboration and licensing revenue: the largest recurring reported operating revenue source in recent periods. This generally includes upfront payments, milestone recognition, and revenue-sharing or licensing-related arrangements with partners.
- Sales from commercialized products at subsidiaries: currently a smaller contributor at the group level than for established biopharma companies, because Roivant remains more pipeline-oriented than product-oriented.
- Technology and service-related revenue: a modest source linked to platform capabilities, research support, or shared services across its portfolio.
- Investment and transaction-related gains: not a core operating revenue line, but often financially important. These can materially affect earnings in some years and are one reason net income can swing sharply from profit to loss.
In short, Roivant is best viewed as a biotech platform and capital allocator built around drug development programs. The upside can be meaningful if a few key assets succeed, but the revenue base is currently narrow and uneven, which is typical for companies still in the clinical and pre-commercial phase.
The cost structure shows a clear pattern: operating expenses are dominated by research and development and corporate overhead, while reported revenue remains very small in comparison. The temporary profit spike in fiscal 2024 appears tied to non-recurring items rather than a lasting change in the underlying operating model, as losses resumed afterward.
Key Figures
| Metric | Value | Sector ⓘ |
|---|---|---|
| Date | Oct 03, 2026 | |
| Context | ||
| Sector | Healthcare | |
| Industry | Biotechnology | |
| Market Cap ⓘ | $26.42B | |
| Beta ⓘ | 1.12 | |
Value (Cheapness) | ||
| P/E Ratio ⓘ | N/A | 24.06 |
| P/B Ratio ⓘ | 7.23 | 3.08 |
| FCF Yield ⓘ | -3.08% | 3.07% |
| Dividend Yield ⓘ | N/A | 2.05% |
| EBIT / EV ⓘ | -1.27% | 0.63% |
| PEG ⓘ | N/A | |
Growth (Business expansion) | ||
| Revenue Growth ⓘ | -33.50% | 7.50% |
| RPS Growth (5Y CAGR) ⓘ | -38.38% | 8.70% |
| EPS Growth (5Y CAGR) ⓘ | -25.13% | -18.20% |
| BVPS Growth (5Y CAGR) ⓘ | 29.91% | 3.95% |
| Margin Growth (5Y Trend) ⓘ | N/A | -0.58% |
| FCF Growth (5Y CAGR) ⓘ | N/A | 0.88% |
| DPS Growth (5Y CAGR) ⓘ | N/A | 6.80% |
Quality (Business durability) | ||
| ROIC (Latest) ⓘ | -5.17% | 3.29% |
| ROA (Latest) ⓘ | -5.14% | 3.02% |
| ROIC (5Y Median) ⓘ | -7.03% | 4.75% |
| ROA (5Y Median) ⓘ | -5.37% | 1.93% |
| Net Debt / EBIT (Latest) ⓘ | N/A | 1.33 |
| Net Debt / EBIT (5Y Median) ⓘ | N/A | 1.83 |
| Net Debt / EBITDA (Latest) ⓘ | N/A | 0.99 |
| Net Debt / Assets ⓘ | -21.51% | 5.33% |
| EBITDA / Interest ⓘ | N/A | 9.63 |
| Operating Margin (Latest) ⓘ | -3848.65% | 9.25% |
| Operating Margin (5Y Median) ⓘ | -2346.02% | 7.80% |
| Debt to Equity (Latest) ⓘ | 2.53% | 28.99% |
| Profit Margin (Latest) ⓘ | N/A | 3.60% |
| Free Cash Flow (Latest) ⓘ | -$813.95M | |
Momentum (Price trend) | ||
| 3Y Return ⓘ | +237.61% | +37.48% |
| 12M Return (excl. last month) ⓘ | +189.35% | +20.85% |
| 6M Return ⓘ | +27.51% | +9.73% |
| Price vs. 200-Day MA ⓘ | +17.90% | +4.69% |
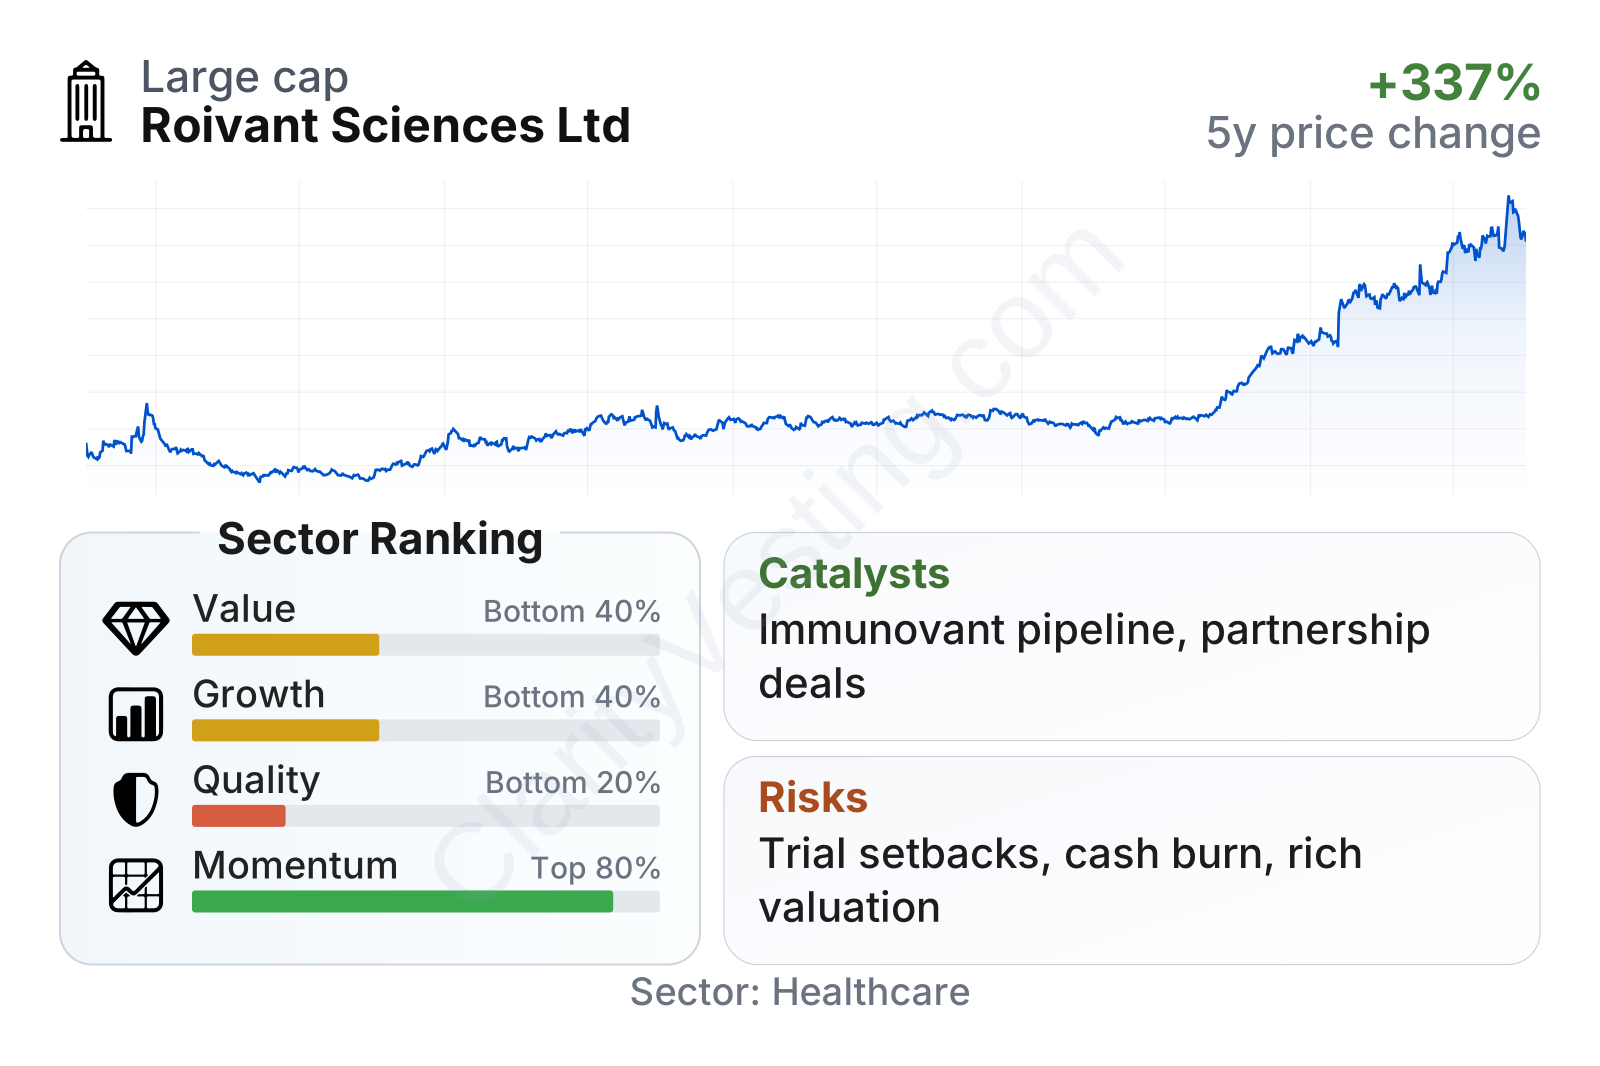
Roivant is now a large-cap biotech by market value, and its share price performance has been much stronger than the sector over the last one, three, and even shorter time frames. That market strength stands in contrast to weaker fundamental rankings in value, growth, and quality. Profitability remains below sector norms, free cash flow is still negative, and traditional valuation measures are less informative because earnings are not consistently positive.
The stock’s recent climb suggests the market is pricing in future pipeline value rather than current operating results. That can work well when development milestones go right, but it also means sentiment can change quickly if expectations slip.
Growth
Biotechnology remains a structurally growing part of healthcare because demand for new treatments continues to expand with aging populations, unmet medical needs, and scientific progress in areas such as immunology, rare diseases, and precision medicine. Roivant is positioned inside that broader growth theme, but its growth profile is not the same as a steadily expanding commercial drug company. It is more event-driven, with value creation depending on clinical results, regulatory progress, partnerships, and selective monetization of assets.
Roivant’s strategy makes sense for future growth if management can continue to identify promising drug candidates, advance them efficiently, and crystallize value through approvals, partnerships, or spinouts. The model is attractive in theory because it spreads opportunity across multiple programs instead of relying on a single asset. It also gives the company flexibility to structure deals around individual subsidiaries rather than the whole organization.
Recent revenue growth has been highly volatile and generally weak. That is not surprising for a company whose reported revenue does not yet reflect a broad base of recurring product sales. For long-term analysis, pipeline progress matters more than near-term top-line smoothness, but the uneven pattern still shows that the business has not reached self-sustaining commercial scale.
Cash generation remains negative, with free cash flow deeply below zero over several years. Even so, there has been some improvement from the worst levels, which suggests spending discipline may be better than before, though not enough to change the overall picture. For a development-stage biotech platform, this is manageable only if the balance sheet stays strong and external funding options remain open.
A major catalyst is the company’s late-stage immunology program led through Immunovant. Roivant has highlighted asset development in autoimmune disease as a central value driver, and progress in that franchise could meaningfully change how the market views the entire group. Additional catalysts can come from new partnership agreements, clinical readouts from other subsidiaries, and regulatory steps that convert research assets into more tangible commercial opportunities.
Recent company updates have also reinforced that Roivant is actively reshaping its portfolio rather than passively waiting for trial results. That matters because the company’s model depends not just on science, but also on active capital allocation. In biotech, strong execution around portfolio management can be almost as important as the underlying research.
Risks
This article is for informational purposes only and does not constitute financial advice. Some content is AI-generated. See Disclaimer


