Stock Analysis · Reliance Worldwide Corporation Limited (RLLWF)
Overview
Reliance Worldwide Corporation Limited is a plumbing and water-flow products company. It designs, manufactures, and sells fittings, valves, pipe connectors, water control devices, and related products used in residential, commercial, and industrial buildings. Its brands are sold mainly through professional plumbing channels, home improvement retailers, and wholesale distribution networks. The company is best known for push-to-connect plumbing solutions, especially under the SharkBite brand, which are designed to make installation faster and simpler than traditional methods.
The business is geographically diversified, with its largest exposure in North America, followed by Europe and the Asia-Pacific region. Revenue is driven mostly by repair, renovation, and maintenance activity rather than only new construction, which can make demand somewhat more resilient because plumbing failures and replacements are often non-discretionary.
Based on company reporting in recent annual materials, the revenue mix is primarily split by region rather than by detailed product line. Approximate revenue contributions are as follows:
- Americas: about 75% to 80% of revenue. This includes push-to-connect fittings, water control valves, supply lines, pipe support and related plumbing products sold heavily in the United States.
- EMEA: about 10% to 15% of revenue. This covers Europe, the Middle East, and Africa, including plumbing and heating-related products.
- Asia-Pacific: about 10% to 15% of revenue. This includes Australia and New Zealand operations as well as regional plumbing product sales.
At a product level, fittings and connectors appear to be the core earnings engine, supported by valves, control products, and other water-flow solutions. The company’s model combines branded innovation, broad channel access, and products that reduce labor time for installers.
The financial picture shows a business that has kept revenue moving upward over the last several years, but profitability has recently come under pressure. Sales have climbed from roughly $1.2 billion to more than $1.3 billion over the 2022 to 2026 period, while gross profit has been less stable and net income fell sharply in the latest year. That pattern suggests the company is still growing its commercial footprint, but recent costs, one-off charges, or margin pressure have weighed heavily on bottom-line results.
Key Figures
| Metric | Value | Sector ⓘ |
|---|---|---|
| Date | Oct 31, 2026 | |
| Context | ||
| Sector | Industrials | |
| Industry | Building Products & Equipment | |
| Market Cap ⓘ | $2.26B | |
| Beta ⓘ | 0.74 | |
Value (Cheapness) | ||
| P/E Ratio ⓘ | 302.00 | 21.91 |
| P/B Ratio ⓘ | 1.75 | 1.97 |
| FCF Yield ⓘ | 13.80% | 6.34% |
| Dividend Yield ⓘ | 0.66% | 1.88% |
| EBIT / EV ⓘ | 9.48% | 4.83% |
| PEG ⓘ | N/A | |
Growth (Business expansion) | ||
| Revenue Growth ⓘ | 3.50% | 9.50% |
| RPS Growth (5Y CAGR) ⓘ | 3.93% | 7.67% |
| EPS Growth (5Y CAGR) ⓘ | 9.18% | -11.63% |
| BVPS Growth (5Y CAGR) ⓘ | 3.90% | 6.14% |
| Margin Growth (5Y Trend) ⓘ | -5.85% | 0.71% |
| FCF Growth (5Y CAGR) ⓘ | N/A | 11.01% |
| DPS Growth (5Y CAGR) ⓘ | -17.07% | 9.31% |
Quality (Business durability) | ||
| ROIC (Latest) ⓘ | N/A | 10.70% |
| ROA (Latest) ⓘ | 0.51% | 5.45% |
| ROIC (5Y Median) ⓘ | 8.29% | 9.33% |
| ROA (5Y Median) ⓘ | 5.76% | 4.94% |
| Net Debt / EBIT (Latest) ⓘ | 1.42 | 2.03 |
| Net Debt / EBIT (5Y Median) ⓘ | 2.46 | 2.28 |
| Net Debt / EBITDA (Latest) ⓘ | 0.98 | 1.37 |
| Net Debt / Assets ⓘ | 16.88% | 19.16% |
| EBITDA / Interest ⓘ | N/A | 9.73 |
| Operating Margin (Latest) ⓘ | 12.59% | 10.49% |
| Operating Margin (5Y Median) ⓘ | 15.08% | 10.30% |
| Debt to Equity (Latest) ⓘ | 29.42% | 65.91% |
| Profit Margin (Latest) ⓘ | 0.48% | 6.61% |
| Free Cash Flow (Latest) ⓘ | $311.70M | |
Momentum (Price trend) | ||
| 3Y Return ⓘ | +38.88% | +69.18% |
| 12M Return (excl. last month) ⓘ | +23.87% | +12.04% |
| 6M Return ⓘ | +50.49% | +0.22% |
| Price vs. 200-Day MA ⓘ | +16.14% | +0.19% |
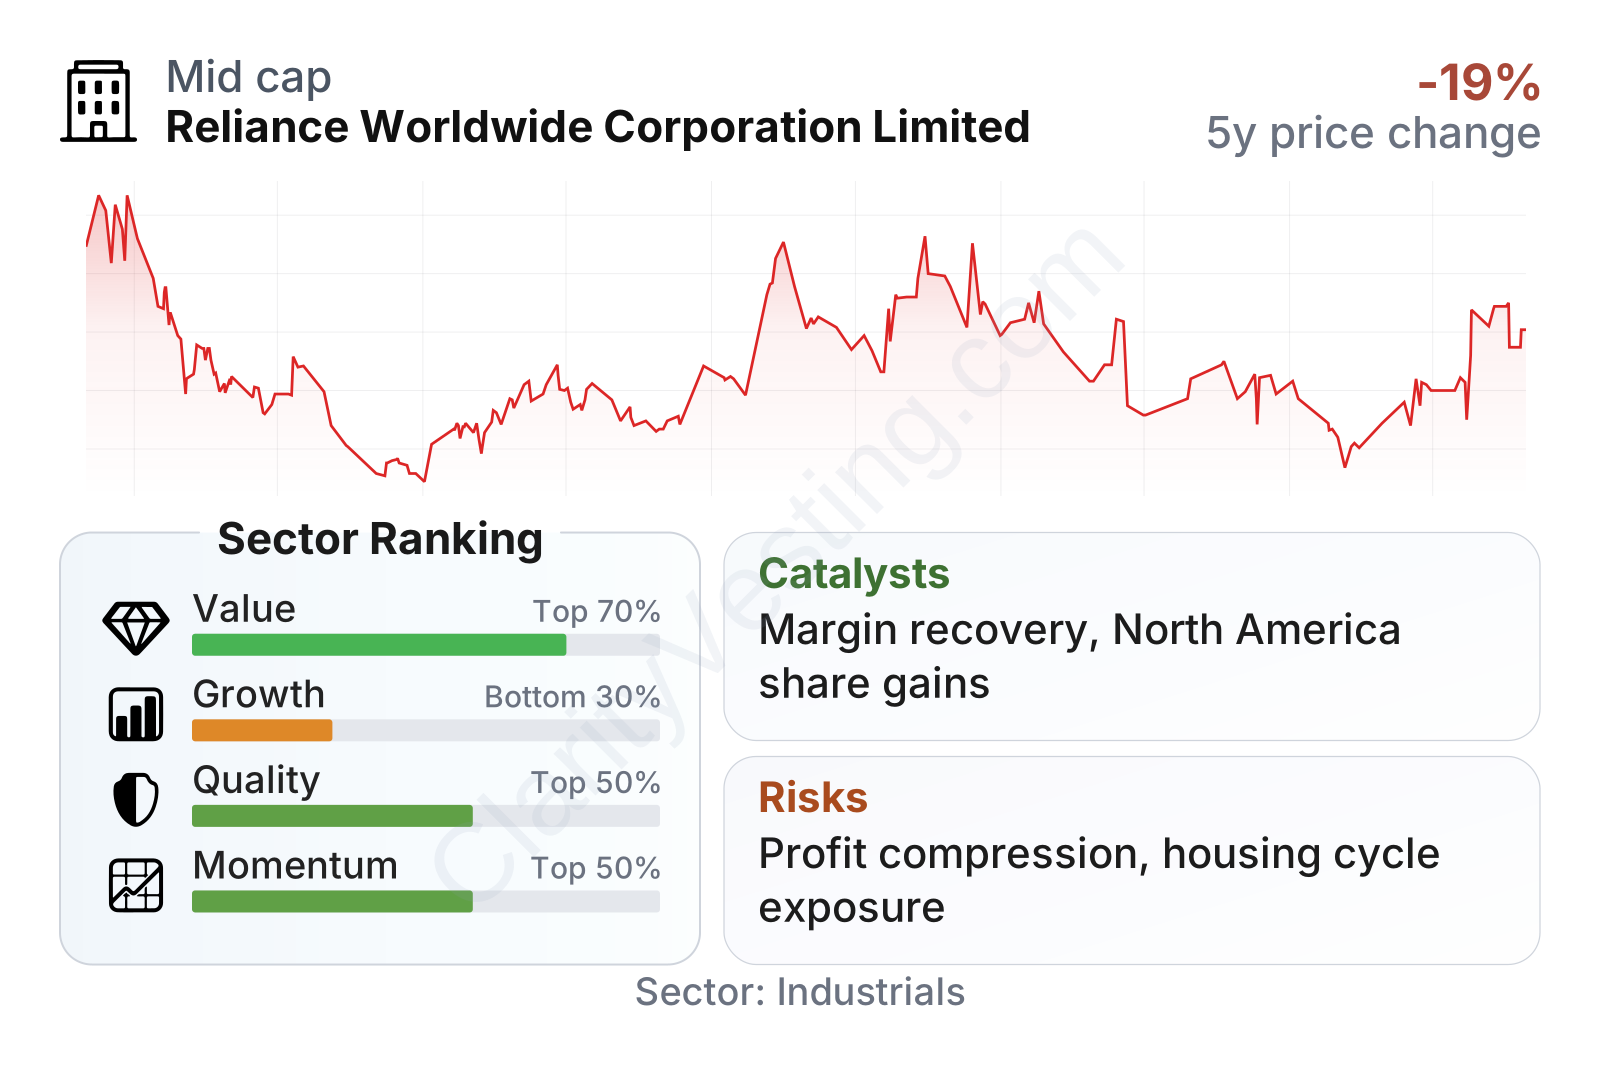
Reliance Worldwide is a mid-sized industrial company with relatively low share-price volatility, as shown by a beta below 1. On valuation and cash generation, the profile is mixed but notable: free cash flow looks strong relative to the company’s size and compares favorably with many peers, while balance sheet leverage appears moderate, with debt-to-equity around 29% and net debt to EBITDA below 1x. Operating margin remains above the sector median, which points to a business with still-solid underlying economics.
The weaker part of the picture is recent earnings quality. The trailing profit margin is extremely thin, around 0.5%, and return on assets is well below the sector median. That helps explain why the headline P/E ratio is unusually high: the earnings base has been temporarily compressed, so the multiple is inflated. Growth indicators also point to a company currently expanding more slowly than much of its sector, especially on revenue and book value trends, even though its longer-term earnings-per-share record remains better than the industry median.
Market performance has improved lately. The stock’s medium-term momentum is stronger than the sector median over the last six to twelve months, although the three-year return still trails many industrial peers. In simple terms, the market seems to be recognizing some operational stabilization, but not yet pricing the company like a high-growth leader.
Growth
Reliance Worldwide operates in a part of the building products industry that benefits from long-term structural demand. Plumbing systems are essential infrastructure, and a large share of industry activity comes from repair and replacement rather than only new housing construction. That matters because aging housing stock, stricter water efficiency standards, and the need for easier installation methods create steady demand for products that save time and reduce labor complexity.
The company’s strategy is logical for this environment. Its push-to-connect and labor-saving products address a real customer problem: qualified trade labor is expensive and often in short supply. Products that cut installation time can win share even in a slower construction market. This is especially relevant in North America, where the company has its strongest presence and where professional contractors and retail channels can scale product adoption quickly.
Another positive point is that the company continues to invest in product development while maintaining a fairly manageable debt profile. Research and development spending remains modest in absolute terms but has been sustained year after year, which supports the case that innovation is central to the business rather than incidental. The balance sheet also leaves room for continued investment in operations, product rollouts, and channel expansion.
A practical catalyst is margin recovery. Revenue has continued to edge upward, but earnings have fallen much more sharply than sales, which implies that if cost pressures ease or exceptional charges fade, profit could recover faster than revenue. Strong free cash flow adds to that possibility because it gives the company internal flexibility even during a weaker earnings period.
Recent operating updates and annual reporting also indicate continued emphasis on productivity, manufacturing efficiency, and portfolio execution. For a company in a mature but necessary category, incremental operational improvement can be a meaningful driver of future results, especially if housing turnover and renovation demand become more supportive.
Risks
This article is for informational purposes only and does not constitute financial advice. Some content is AI-generated. See Disclaimer


