Stock Analysis · RLJ Lodging Trust (RLJ-PA)
Overview
RLJ Lodging Trust is a hotel real estate investment trust, or REIT. In simple terms, it owns hotels rather than operating a broad real estate platform such as offices, apartments, or warehouses. Its portfolio is concentrated in the U.S. and focuses mainly on premium-branded hotels in urban locations and key travel markets. Most of the properties are affiliated with large hotel systems such as Marriott, Hilton, and Hyatt, which matters because brand distribution, loyalty programs, and reservation platforms help support occupancy and room pricing.
Its business model is straightforward: RLJ collects hotel-level revenue generated by its properties, while third-party managers typically run day-to-day operations. Because it is a hotel REIT, results are more directly tied to travel demand than many other kinds of real estate. When business travel, group events, and leisure demand are healthy, room rates and occupancy can rise quickly. The opposite is also true during slowdowns.
The company’s revenue mix is primarily hotel operating revenue. Based on recent annual reporting, the largest sources are approximately:
- Rooms: about 73% to 76% of total revenue. This is the core of the business and includes nightly room sales.
- Food and beverage: about 15% to 18%. This includes restaurants, bars, banquets, and catering tied to meetings and events.
- Other hotel revenue: about 7% to 10%. This generally includes parking, resort or destination fees where applicable, meeting space rentals, and other on-property services.
That mix shows a business centered on room demand, with added upside from group events and ancillary spending. Over the last several years, revenue recovered strongly from pandemic-era weakness, while profitability improved more gradually as labor, insurance, and interest costs remained meaningful. RLJ is therefore best understood as a mid-sized lodging landlord with recognizable hotel brands and a portfolio geared toward travel recovery and pricing power rather than ultra-stable rent streams.
The multi-year income flow shows a clear recovery from 2021 losses to positive operating income and net income in the following years. Revenue expanded materially through 2024, but the later period also suggests pressure from costs and interest expense, which helps explain why earnings have not risen as fast as sales.
Key Figures
| Metric | Value | Sector ⓘ |
|---|---|---|
| Date | Oct 17, 2026 | |
| Context | ||
| Sector | Real Estate | |
| Industry | REIT - Hotel & Motel | |
| Market Cap ⓘ | $2.88B | |
| Beta ⓘ | 1.14 | |
Value (Cheapness) | ||
| P/E Ratio ⓘ | N/A | 17.38 |
| P/B Ratio ⓘ | 1.72 | 0.85 |
| FCF Yield ⓘ | 9.26% | 7.38% |
| Dividend Yield ⓘ | 2.44% | 4.85% |
| EBIT / EV ⓘ | 2.36% | 3.78% |
| PEG ⓘ | N/A | |
Growth (Business expansion) | ||
| Revenue Growth ⓘ | 5.60% | 5.30% |
| RPS Growth (5Y CAGR) ⓘ | 17.14% | 6.02% |
| EPS Growth (5Y CAGR) ⓘ | N/A | -11.37% |
| BVPS Growth (5Y CAGR) ⓘ | 3.86% | 0.45% |
| Margin Growth (5Y Trend) ⓘ | 36.23% | -0.22% |
| FCF Growth (5Y CAGR) ⓘ | 28.57% | 5.40% |
| DPS Growth (5Y CAGR) ⓘ | 41.52% | 5.02% |
Quality (Business durability) | ||
| ROIC (Latest) ⓘ | 2.93% | 5.69% |
| ROE (Latest) ⓘ | 1.27% | 7.56% |
| ROA (Latest) ⓘ | 0.55% | 2.85% |
| ROIC (5Y Median) ⓘ | 3.12% | 4.22% |
| ROE (5Y Median) ⓘ | 1.29% | 6.03% |
| ROA (5Y Median) ⓘ | 0.83% | 2.44% |
| Net Debt / EBIT (Latest) ⓘ | 13.45 | 7.59 |
| Net Debt / EBIT (5Y Median) ⓘ | 12.61 | 8.40 |
| Net Debt / EBITDA (Latest) ⓘ | 5.65 | 5.27 |
| Net Debt / Assets ⓘ | 35.86% | 37.76% |
| EBITDA / Interest ⓘ | 3.00 | 4.10 |
| Operating Margin (Latest) ⓘ | 10.10% | 35.29% |
| Operating Margin (5Y Median) ⓘ | 10.97% | 37.31% |
| Debt to Equity (Latest) ⓘ | 130.79% | 88.87% |
| Profit Margin (Latest) ⓘ | 2.00% | 19.61% |
| Free Cash Flow (Latest) ⓘ | $266.99M | |
Momentum (Price trend) | ||
| 3Y Return ⓘ | +30.75% | +30.75% |
| 12M Return (excl. last month) ⓘ | +6.66% | +4.36% |
| 6M Return ⓘ | +1.55% | -2.52% |
| Price vs. 200-Day MA ⓘ | +1.38% | -2.34% |
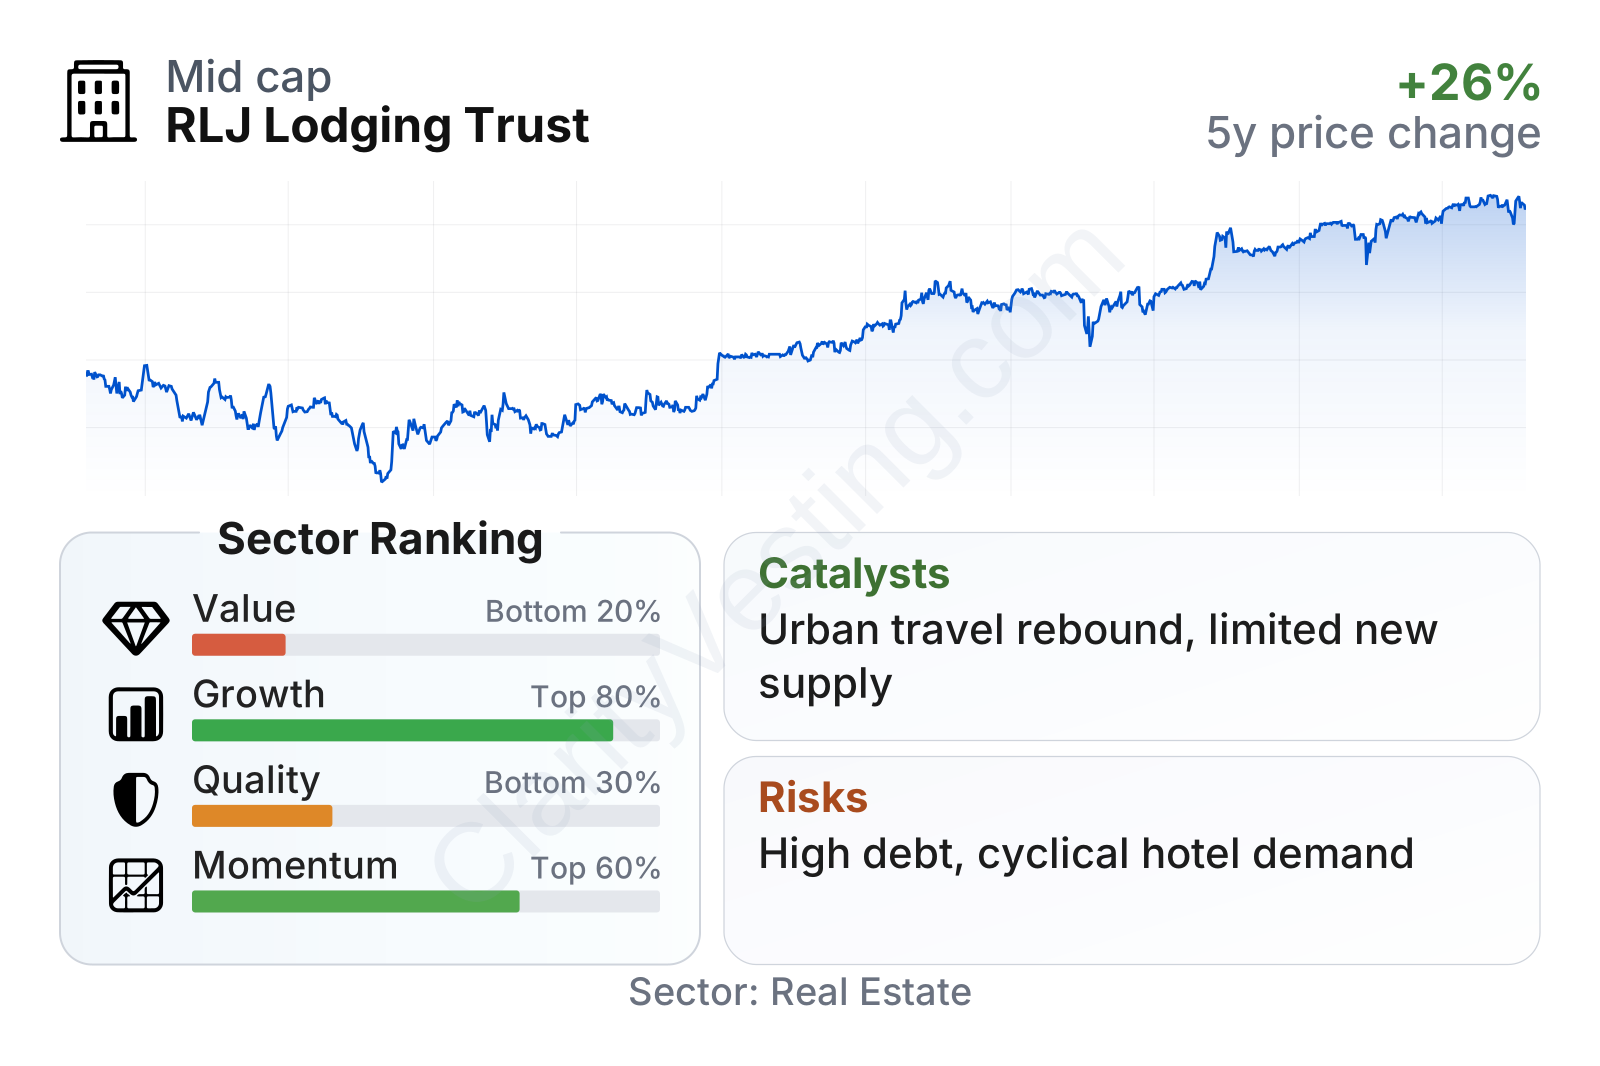
RLJ sits in the mid-sized range within real estate, with share price behavior that has been somewhat more volatile than the broader market. The overall profile is mixed: growth metrics are better than much of the sector, momentum is around the middle to slightly above, while value and quality rank weaker. In practical terms, that means the company has posted solid business recovery and cash generation, but profitability, leverage, and balance-sheet efficiency still look less favorable than many peers.
The market-based picture also reflects that mix. Over the past several years, the stock has trended upward from the post-reopening period, though not in a straight line. Meanwhile, free cash flow yield is relatively strong, but book-based valuation and operating returns are not especially attractive compared with the broader real estate group.
Growth
The lodging sector can grow over time, but it is cyclical rather than steadily expanding every year. RLJ operates in a part of real estate that benefits from several long-term supports: continued U.S. travel demand, limited new hotel supply in many urban markets, and the ability to reprice rooms daily instead of waiting years for lease resets. That last point is important because it can help hotel owners keep up with inflation faster than landlords in some other property types.
RLJ’s strategy is sensible for this kind of business. The company focuses on higher-quality branded hotels in markets where replacement costs are high and where major brands can drive reservations. It has also emphasized portfolio recycling and balance-sheet discipline over time, seeking to exit weaker assets and direct capital toward properties with better demand patterns. For a hotel REIT, that is often where long-term value creation comes from: not just owning hotels, but owning the right hotels in the right demand pockets.
Revenue per share has risen strongly since 2021 and appears to have moved from rebound mode into slower, steadier growth. The biggest jump came with the post-pandemic recovery, while the more recent pattern suggests the business is now relying more on incremental pricing, mix improvement, and operating execution than on easy year-over-year comparisons.
The dividend per share trend is also notable. Payouts have been rebuilt quickly from depressed levels, which points to improving cash generation and a more normalized operating environment. Even so, the current yield remains below the real estate sector median, so the dividend case is more about recovery and growth than about unusually high income today.
A meaningful catalyst for RLJ is the continued normalization of urban and group travel. Hotels with exposure to meetings, corporate travel, and city-center demand often lagged purely leisure-oriented assets in the initial recovery, which leaves room for further improvement if those segments continue strengthening. Another supportive factor is limited industry-wide new supply in many markets, which can help existing hotels maintain room-rate discipline.
Recent company updates have also centered on capital allocation, property-level performance, and maintaining liquidity. For RLJ, future upside depends less on a single breakthrough event and more on steady execution: improving occupancy, pushing average daily rates, controlling costs, and managing debt in a higher-rate environment.
Risks
This article is for informational purposes only and does not constitute financial advice. Some content is AI-generated. See Disclaimer


