Stock Analysis · Relay Therapeutics Inc (RLAY)
Overview
Relay Therapeutics is a biotechnology company focused on discovering and developing precision medicines for cancer and certain genetic diseases. Its scientific approach is built around understanding how proteins move and change shape, with the goal of designing drugs that can target disease-causing mutations more precisely. For a long-term reader, the key point is that this is not a mature pharmaceutical business with broad commercial sales today; it is still primarily a research-and-development company whose value depends heavily on the progress of its drug pipeline.
The company’s leading programs have centered on targeted oncology, including candidates aimed at PI3K-alpha mutations and FGFR2 alterations, along with earlier-stage work in additional precision medicine areas. Relay has also used partnerships to help fund parts of its research platform. That means the business model today is a mix of internal drug development and collaboration-related payments rather than recurring product revenue from a large marketed drug portfolio.
Based on recent annual results, Relay’s revenue remains small and uneven, which is typical for a clinical-stage biotech. The main sources of revenue are approximately:
- Collaboration and licensing revenue: about 100% of current revenue. This mainly reflects research collaborations, option payments, milestone-related recognition, or other partnership accounting rather than broad commercial drug sales.
- Product revenue: about 0%. Relay does not currently operate like an established commercial drug company with material recurring sales from approved products.
This revenue mix matters because it makes reported sales volatile from year to year. In Relay’s case, the much more important operating driver is spending on research and development, which remains the company’s dominant use of cash as it tries to move drug candidates through clinical trials.
The business remains shaped by heavy research spending and persistent losses, although expense control improved in 2025 compared with prior years. Revenue is too small to offset development costs, so the central question is not current earnings power but whether the pipeline can create future commercial value.
Key Figures
| Metric | Value | Sector ⓘ |
|---|---|---|
| Date | Oct 17, 2026 | |
| Context | ||
| Sector | Healthcare | |
| Industry | Biotechnology | |
| Market Cap ⓘ | $3.74B | |
| Beta ⓘ | 1.73 | |
Value (Cheapness) | ||
| P/E Ratio ⓘ | N/A | 24.79 |
| P/B Ratio ⓘ | 3.94 | 3.08 |
| FCF Yield ⓘ | -5.68% | 3.15% |
| Dividend Yield ⓘ | N/A | 1.94% |
| EBIT / EV ⓘ | -9.31% | 0.57% |
| PEG ⓘ | N/A | |
Growth (Business expansion) | ||
| Revenue Growth ⓘ | -48.30% | 7.45% |
| RPS Growth (5Y CAGR) ⓘ | 29.48% | 8.61% |
| EPS Growth (5Y CAGR) ⓘ | -26.50% | -17.81% |
| BVPS Growth (5Y CAGR) ⓘ | -23.07% | 3.72% |
| Margin Growth (5Y Trend) ⓘ | N/A | -0.62% |
| FCF Growth (5Y CAGR) ⓘ | N/A | 1.04% |
| DPS Growth (5Y CAGR) ⓘ | N/A | 6.77% |
Quality (Business durability) | ||
| ROIC (Latest) ⓘ | -32.97% | 3.24% |
| ROA (Latest) ⓘ | -34.94% | 3.01% |
| ROIC (5Y Median) ⓘ | -32.07% | 4.60% |
| ROA (5Y Median) ⓘ | -37.05% | 1.89% |
| Net Debt / EBIT (Latest) ⓘ | N/A | 1.34 |
| Net Debt / EBIT (5Y Median) ⓘ | N/A | 1.84 |
| Net Debt / EBITDA (Latest) ⓘ | N/A | 1.00 |
| Net Debt / Assets ⓘ | -9.36% | 5.45% |
| EBITDA / Interest ⓘ | N/A | 9.64 |
| Operating Margin (Latest) ⓘ | -2763.64% | 9.27% |
| Operating Margin (5Y Median) ⓘ | -3854.04% | 7.38% |
| Debt to Equity (Latest) ⓘ | 3.44% | 28.58% |
| Profit Margin (Latest) ⓘ | N/A | 3.59% |
| Free Cash Flow (Latest) ⓘ | -$212.21M | |
Momentum (Price trend) | ||
| 3Y Return ⓘ | +149.46% | +42.80% |
| 12M Return (excl. last month) ⓘ | +367.24% | +18.50% |
| 6M Return ⓘ | +11.68% | +7.57% |
| Price vs. 200-Day MA ⓘ | +19.84% | +5.12% |
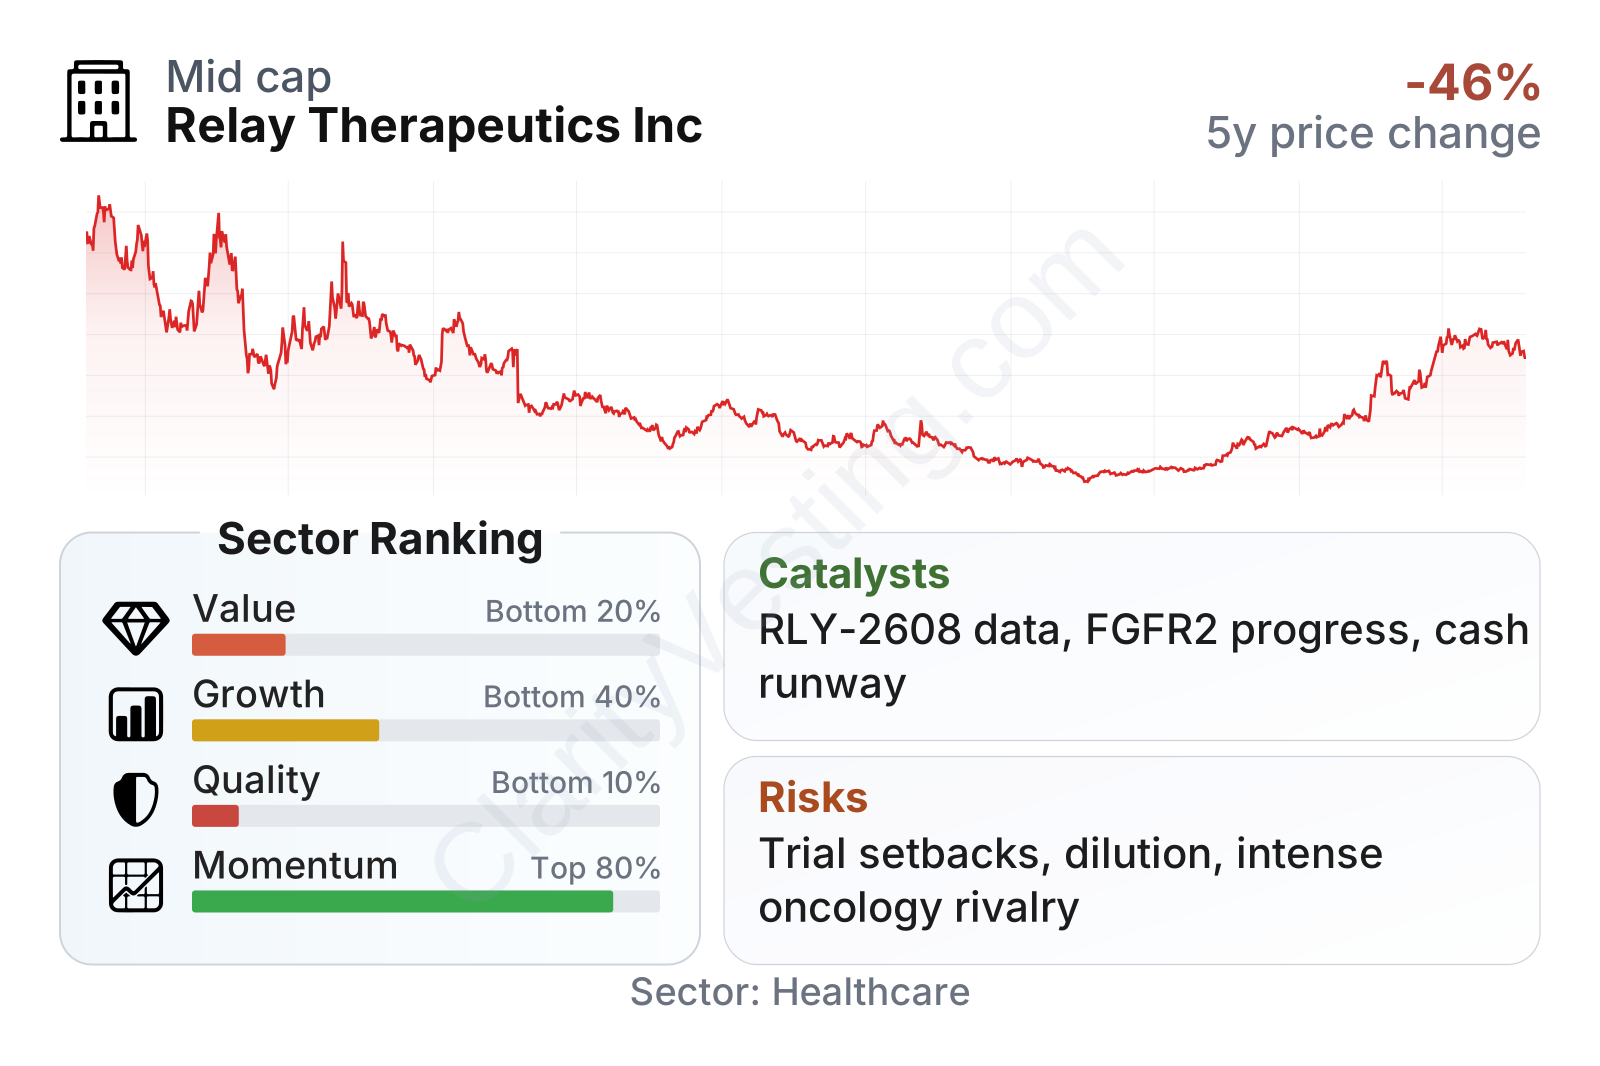
The stock has been highly volatile, with a deep decline through 2024 and early 2025 followed by a sharp recovery into 2026. In the factor breakdown, valuation and quality rank poorly versus the healthcare sector, which is normal for a company that is still loss-making and pre-commercial. Growth metrics are mixed because longer-term revenue per share has expanded from a low base, but recent year-over-year revenue has fallen sharply. Momentum stands out as unusually strong, showing that the market has recently become much more optimistic about Relay’s prospects.
Relay is a mid-sized biotech by market value, and its share price has shown above-average sensitivity to market moves. That can create large swings in sentiment around trial updates, regulatory events, and financing expectations.
Growth
Relay operates in one of the most attractive long-term areas of healthcare: precision medicine in oncology. Cancer treatment is steadily moving toward more targeted therapies aimed at specific mutations, and companies that can show strong efficacy with manageable safety can build meaningful commercial positions even in narrow patient populations. That industry direction supports Relay’s strategic logic. The company is not trying to compete as a broad drugmaker; it is focusing on difficult mutation-defined markets where a successful medicine can still generate substantial value.
A major part of the growth case rests on the company’s lead clinical programs. The most important catalyst is continued clinical progress for RLY-2608, Relay’s mutant-selective PI3K-alpha inhibitor, including combination development in breast cancer and other settings where PI3K pathway mutations matter. A second important growth driver is lirafugratinib in FGFR2-altered cancers, where differentiation on efficacy, durability, and tolerability could matter if development continues to advance well. In biotech, one or two successful late-stage assets can transform the revenue profile very quickly, which is why pipeline quality matters more than current sales.
Reported revenue does not show a clean growth pattern because it mainly comes from collaborations instead of product sales. That makes year-over-year comparisons noisy and less informative than pipeline milestones. The recent decline in reported revenue is therefore not, by itself, the main sign of weakening demand; it mostly reflects the accounting nature of partnership revenue in a clinical-stage biotech.
Cash flow remains negative, but the burn rate appears to have improved from the worst levels seen in prior periods. For a company at Relay’s stage, this is an important point: progress is not measured by free cash flow turning positive soon, but by whether spending is being converted into valuable clinical data while preserving enough financial flexibility to avoid frequent capital pressure.
Recent company updates have kept attention on clinical execution and data readouts rather than commercial performance. For long-term analysis, that means the most meaningful opportunities are tied to trial results, expansion into additional indications, potential regulatory progress, and the possibility of future partnership economics if a program becomes more attractive to larger pharmaceutical companies.
Risks
This article is for informational purposes only and does not constitute financial advice. Some content is AI-generated. See Disclaimer


