Stock Analysis · RIT Capital Partners (RITPF)
Overview
RIT Capital Partners is a publicly listed investment company focused on preserving and compounding wealth over long periods. Rather than operating a traditional single-line business, it allocates capital across a broad portfolio that includes quoted equities, private investments, absolute return and hedge fund strategies, credit, real assets, and a meaningful cash and liquidity reserve. The firm is closely associated with the Rothschild family heritage and is designed more like a diversified multi-asset portfolio than a conventional asset manager with fee-driven economics.
Its economic results mainly come from changes in the value of its investments, plus income generated by those holdings such as dividends, interest, and realized gains. Because of that structure, reported earnings can move sharply from year to year depending on market conditions, even when the underlying portfolio construction remains disciplined.
Based on recent portfolio disclosures from the company, the asset mix is broadly diversified and revenue cannot be cleanly split like an industrial business. A practical way to understand the company is through its investment exposure, which is the main driver of long-term returns:
- Quoted equities: approximately 30% to 40% of assets in recent periods. This includes listed shares across major markets and remains an important source of capital appreciation.
- Private investments: approximately 20% to 30%. This bucket includes private equity, direct investments, and externally managed private vehicles, often with a longer time horizon.
- Absolute return and hedge funds: approximately 15% to 25%. These strategies aim to reduce correlation with stock markets and provide downside resilience.
- Credit and fixed income: approximately 5% to 15%. This includes debt instruments and other income-oriented exposures.
- Real assets and other investments: typically a smaller share, including assets linked to inflation protection or diversification.
- Cash and near-cash liquidity: often around 10% to 20%, giving the company flexibility during volatile markets.
This diversified setup is central to the case for RIT Capital Partners: it is not trying to maximize short-term upside in one asset class, but to deliver steadier compounding with lower dependence on any single market outcome.
The earnings flow has been highly uneven, which is normal for an investment company. Operating costs have stayed relatively modest relative to asset size, while bottom-line results have swung from losses in weak markets to very strong profits in stronger periods. That pattern shows how much performance depends on portfolio valuations rather than on a stable recurring operating revenue base.
Key Figures
| Metric | Value | Sector ⓘ |
|---|---|---|
| Date | Oct 24, 2026 | |
| Context | ||
| Sector | Financial Services | |
| Industry | Asset Management | |
| Market Cap ⓘ | $4.07B | |
| Beta ⓘ | 0.31 | |
Value (Cheapness) | ||
| P/E Ratio ⓘ | 10.83 | 12.46 |
| P/B Ratio ⓘ | 1.06 | 1.25 |
| FCF Yield ⓘ | 10.86% | 9.82% |
| Dividend Yield ⓘ | 1.33% | 2.94% |
| EBIT / EV ⓘ | N/A | 8.11% |
| PEG ⓘ | N/A | |
Growth (Business expansion) | ||
| Revenue Growth ⓘ | 148.40% | 9.10% |
| RPS Growth (5Y CAGR) ⓘ | 26.36% | 12.31% |
| EPS Growth (5Y CAGR) ⓘ | -2.54% | -6.97% |
| BVPS Growth (5Y CAGR) ⓘ | 0.80% | 5.02% |
| Margin Growth (5Y Trend) ⓘ | -3921.62% | -4.00% |
| FCF Growth (5Y CAGR) ⓘ | 144.03% | 4.71% |
| DPS Growth (5Y CAGR) ⓘ | 13.50% | 8.92% |
Quality (Business durability) | ||
| ROIC (Latest) ⓘ | N/A | 9.18% |
| ROE (Latest) ⓘ | 24.50% | 13.93% |
| ROA (Latest) ⓘ | 21.84% | 1.57% |
| ROIC (5Y Median) ⓘ | N/A | 7.80% |
| ROE (5Y Median) ⓘ | 8.28% | 12.15% |
| ROA (5Y Median) ⓘ | 7.42% | 1.28% |
| Net Debt / EBIT (Latest) ⓘ | N/A | 1.02 |
| Net Debt / EBIT (5Y Median) ⓘ | 0.29 | 0.72 |
| Net Debt / EBITDA (Latest) ⓘ | 0.13 | 0.88 |
| Operating Margin (Latest) ⓘ | N/A | 22.30% |
| Operating Margin (5Y Median) ⓘ | 1145.58% | 24.50% |
| Debt to Equity (Latest) ⓘ | 8.47% | 59.34% |
| Profit Margin (Latest) ⓘ | 91.68% | 26.42% |
| Free Cash Flow (Latest) ⓘ | $442.37M | |
Momentum (Price trend) | ||
| 3Y Return ⓘ | +56.45% | +95.73% |
| 12M Return (excl. last month) ⓘ | +31.73% | +17.30% |
| 6M Return ⓘ | +15.05% | +6.07% |
| Price vs. 200-Day MA ⓘ | +19.20% | +5.36% |
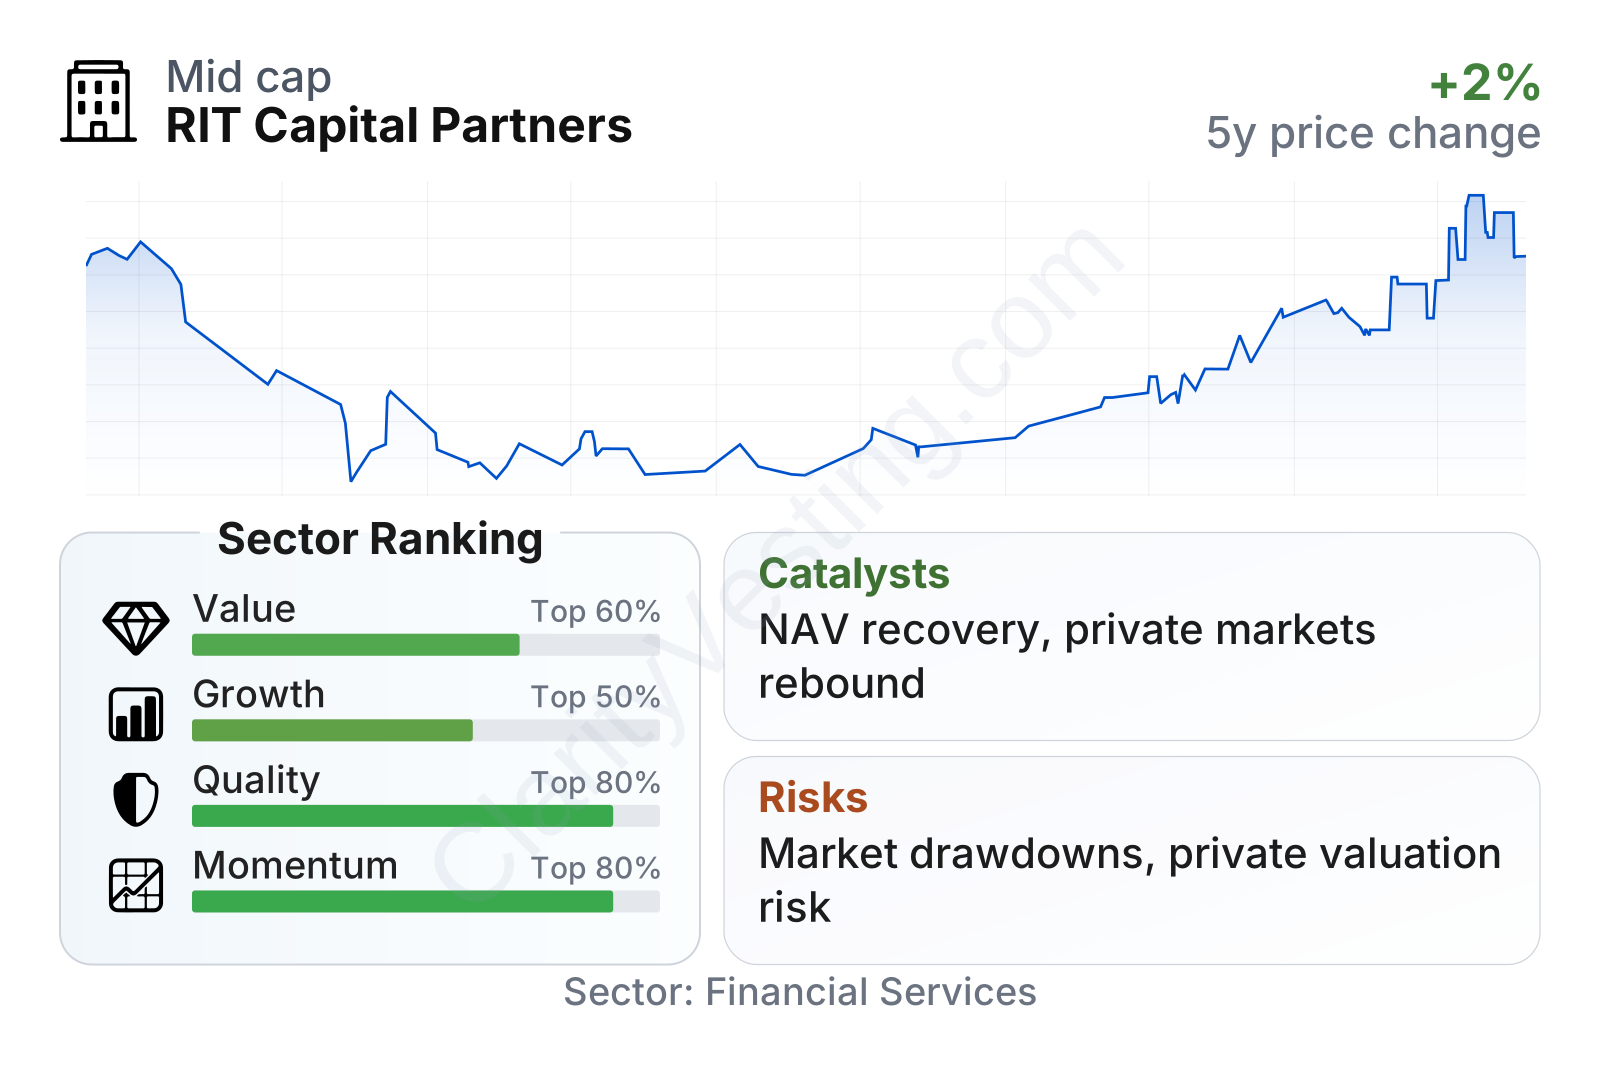
RIT Capital Partners sits in the middle of the sector on headline valuation but looks stronger on quality and recent share-price momentum. The balance sheet appears conservative, with low leverage compared with many financial peers, while profitability ratios are unusually high because investment gains have been strong. Growth metrics need more caution: some look exceptional, but they are influenced by market-driven swings that can reverse quickly. The stock has also recovered notably from its 2025 lows and now trades closer to the value of its underlying assets than it did then.
The company is mid-sized rather than a giant in global finance, and its low beta suggests that its share price has tended to move less violently than the broader market. That fits its role as a capital-preservation-oriented listed investment vehicle rather than a pure high-growth financial stock.
Growth
RIT Capital Partners operates in a sector that should remain relevant as long as investors seek diversified access to global assets and private markets. Wealth preservation, alternative investments, private capital, and multi-asset allocation are all areas with durable demand, especially in a world shaped by inflation uncertainty, geopolitical tension, and uneven stock and bond returns. In that sense, the company is positioned in a growing part of finance, even if its own results will not follow a smooth upward line every year.
Its strategy also makes sense for future growth because it is built around flexibility. Management can shift capital across public equities, private assets, hedge funds, credit, and cash depending on valuations and risk conditions. That freedom matters when traditional asset classes become expensive or when dislocations create opportunities. RIT’s structure allows it to act more patiently than many open-ended funds, because it is not forced to meet daily redemptions.
Earnings can be very lumpy, which is typical here. A strong full-year result can be followed by a much smaller interim figure without signaling a structural problem. What matters more is whether investment gains are translating into growth in net asset value and shareholder capital over time rather than in any single reporting period.
Book value per share is especially important for this company because it is a close proxy for the underlying value of its investment portfolio. After falling in 2022 and remaining subdued in 2023, book value recovered in 2024 and reached a new high in 2025. That recovery supports the view that the company has rebuilt portfolio value after the difficult market reset.
One notable catalyst is the combination of dry powder and broad asset exposure. If private markets reopen more fully, deal activity improves, or listed markets remain supportive, RIT can benefit through multiple channels. Another positive factor is that investment trusts sometimes gain attention when their shares trade below asset value and later narrow that discount. Recent momentum in the share price suggests the market has already started to recognize some of that improvement.
Recent company updates have also highlighted continued portfolio activity and capital allocation discipline rather than a major strategic disruption. For a firm like RIT, that steadiness is itself meaningful: it reinforces the idea that management is sticking to a long-term framework instead of chasing short-term themes.
Risks
This article is for informational purposes only and does not constitute financial advice. Some content is AI-generated. See Disclaimer


