Stock Analysis · Rio2 Limited (RIOFF)
Overview
Rio2 Limited is a gold development company focused on building and operating mining assets in the Americas. Its main asset is the Fenix Gold Project in Chile, a large oxide gold project located in the Maricunga gold belt in the Atacama region. At this stage, Rio2 is not a diversified producer with multiple operating mines. It is primarily a single-asset developer whose value depends heavily on advancing Fenix from development into commercial production.
That business profile is important for long-term analysis because Rio2 is not yet driven by broad operating revenue. Instead, the company’s economic case rests on permitting progress, construction execution, project financing, and the future cash flow potential of Fenix once it reaches production.
Based on recent public filings and company materials, Rio2’s revenue sources are currently very limited and not representative of a mature mining company. In practical terms, the business is tied overwhelmingly to one source of future value:
- Future gold production from the Fenix Gold Project: effectively the dominant source of expected long-term revenue, with the project designed as a heap-leach gold operation.
- Other income and non-operating items: currently minor and irregular, with no meaningful recurring contribution disclosed as a stable operating segment.
Because the company is still in the development stage, recent financial statements show little to no operating revenue. That means the usual revenue breakdown by product, geography, or business line is not yet very useful here; the investment case is centered on whether one major project can be built on time, on budget, and eventually generate attractive margins in a supportive gold-price environment.
The multi-year income flow also reflects this transition stage: operating costs and corporate expenses have dominated results, while accounting profitability has fluctuated with financing and non-cash items rather than with mine production. In other words, Rio2 still looks more like a project company than a conventional gold miner.
The financial flow over recent years shows a business with almost no revenue but meaningful administrative and development-related costs. One notable improvement appeared in 2024, when losses narrowed sharply, but that did not mark a full operating transformation; 2025 moved back to a larger loss profile, underscoring that Rio2 remains dependent on project advancement rather than ongoing mine output.
Key Figures
| Metric | Value | Sector ⓘ |
|---|---|---|
| Date | Oct 17, 2026 | |
| Context | ||
| Sector | Basic Materials | |
| Industry | Gold | |
| Market Cap ⓘ | $1.20B | |
| Beta ⓘ | 2.16 | |
Value (Cheapness) | ||
| P/E Ratio ⓘ | 21.80 | 16.90 |
| P/B Ratio ⓘ | 2.93 | 1.65 |
| FCF Yield ⓘ | -0.01% | 5.76% |
| Dividend Yield ⓘ | N/A | 2.13% |
| EBIT / EV ⓘ | 5.31% | 6.30% |
| PEG ⓘ | N/A | |
Growth (Business expansion) | ||
| Revenue Growth ⓘ | N/A | 11.10% |
| RPS Growth (5Y CAGR) ⓘ | N/A | 4.49% |
| EPS Growth (5Y CAGR) ⓘ | -7.68% | -13.47% |
| BVPS Growth (5Y CAGR) ⓘ | -5.07% | 5.51% |
| Margin Growth (5Y Trend) ⓘ | N/A | -1.54% |
| FCF Growth (5Y CAGR) ⓘ | -36.40% | 0.37% |
| DPS Growth (5Y CAGR) ⓘ | N/A | 6.08% |
Quality (Business durability) | ||
| ROIC (Latest) ⓘ | 21.94% | 9.26% |
| ROA (Latest) ⓘ | 7.82% | 4.91% |
| ROIC (5Y Median) ⓘ | -9.28% | 7.70% |
| ROA (5Y Median) ⓘ | -4.25% | 3.86% |
| Net Debt / EBIT (Latest) ⓘ | 0.46 | 1.40 |
| Net Debt / EBIT (5Y Median) ⓘ | N/A | 1.70 |
| Net Debt / EBITDA (Latest) ⓘ | 0.34 | 0.95 |
| Net Debt / Assets ⓘ | 2.99% | 13.69% |
| EBITDA / Interest ⓘ | 19.24 | 12.34 |
| Operating Margin (Latest) ⓘ | 45.95% | 13.20% |
| Operating Margin (5Y Median) ⓘ | N/A | 11.80% |
| Debt to Equity (Latest) ⓘ | N/A | 40.56% |
| Profit Margin (Latest) ⓘ | 34.02% | 6.43% |
| Free Cash Flow (Latest) ⓘ | -$145.00K | |
Momentum (Price trend) | ||
| 3Y Return ⓘ | +1258.11% | +68.89% |
| 12M Return (excl. last month) ⓘ | +100.79% | +30.21% |
| 6M Return ⓘ | -2.85% | -4.16% |
| Price vs. 200-Day MA ⓘ | -9.61% | -1.27% |
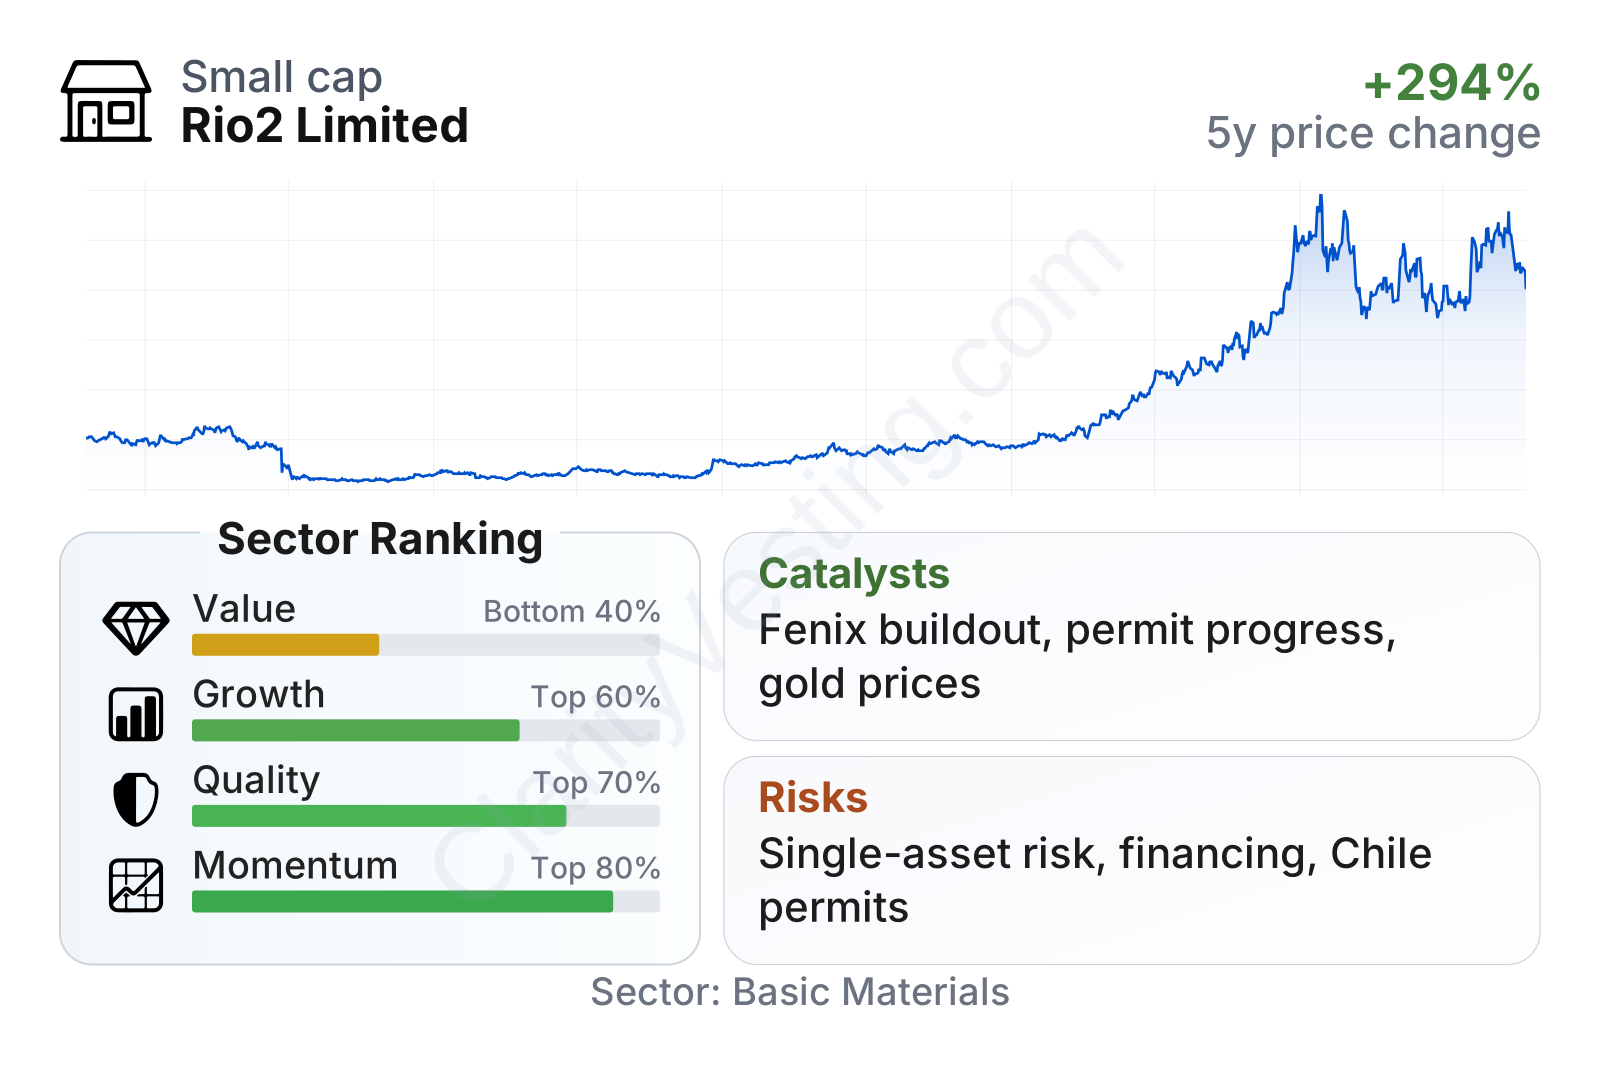
Rio2 currently sits in the small-to-mid-cap range and has a high beta, which points to above-average share price volatility. The stock’s multi-year performance has been very strong, especially from 2024 into early 2026, but the path has been highly uneven, with sharp drawdowns along the way. That pattern is common in single-asset mining developers, where valuation can shift quickly with permitting, financing, and construction milestones.
The metrics table paints a mixed but understandable picture. Valuation appears less attractive than the sector median on traditional measures such as price-to-earnings and price-to-book, while free cash flow remains slightly negative. At the same time, quality indicators look stronger than many peers, with low leverage relative to assets, solid interest coverage, and unusually high reported margins for the latest period. Those profitability measures should be read carefully, however, because Rio2 is not yet a mature producing miner and accounting results can be distorted by non-recurring items.
Growth indicators are only middle-of-the-pack. Revenue growth is effectively at 0% because the company has not yet entered meaningful production, while longer-term free cash flow and book value trends remain weak. Momentum is much stronger than the underlying operating history, which suggests the market has already been pricing in major progress at Fenix.
Growth
Rio2 operates in a sector with long-term relevance. Gold continues to benefit from central bank demand, inflation hedging, geopolitical uncertainty, and the search for hard-asset exposure. That does not guarantee success for every mining company, but it creates a supportive backdrop for projects that can be built economically and permitted successfully.
Rio2’s strategy is straightforward and makes industrial sense: concentrate capital and management attention on one large oxide gold project that can use heap-leach processing, a method generally considered simpler and less capital-intensive than many sulfide-based developments. The company has emphasized a phased and relatively disciplined path to construction at Fenix, which matters because cost overruns are one of the biggest destroyers of value in mining development.
A major catalyst has been the regulatory and construction path for Fenix Gold. Recent company updates have highlighted progress on permits, financing arrangements, and preparation activities needed to move the project toward build-out. For a company like Rio2, each step that reduces execution uncertainty can have an outsized effect because there is only one core asset carrying most of the equity value.
Another important tailwind is the gold price itself. When gold prices remain high, project economics usually improve through stronger expected margins, faster payback, and better financing conditions. That can be especially meaningful for a developer nearing the build stage rather than for a company already locked into mature operations.
Free cash flow remains negative, but that is not surprising for a pre-production miner. What matters more is whether spending is translating into visible de-risking of the project. In Rio2’s case, the core question is not near-term cash generation; it is whether today’s outlays are bringing Fenix closer to becoming a producing mine with durable future cash flow.
If Rio2 executes well, the strongest growth inflection would come from the shift from development company to producing gold miner. That is typically the stage where valuation frameworks begin to change materially, because markets can move from looking at project potential to measuring actual production, costs, margins, and reserve conversion.
Risks
This article is for informational purposes only and does not constitute financial advice. Some content is AI-generated. See Disclaimer


