Stock Analysis · Rio Tinto (RIO)
Overview
Rio Tinto is one of the world’s largest mining groups. It produces bulk materials and metals used in construction, steelmaking, transportation, electrical networks, packaging, and increasingly the energy transition. Its operations span iron ore, aluminum, copper, lithium, and other minerals, with a particularly strong footprint in Australia, where its Pilbara iron ore system is one of the company’s most important assets.
The business is still heavily driven by iron ore, which makes Rio Tinto highly sensitive to steel demand and to China’s industrial activity. At the same time, management has been pushing to broaden the portfolio toward materials linked to electrification, especially copper and lithium. That matters for long-term analysis because the company combines a mature cash engine with a pipeline of assets that could change its revenue mix over time.
Based on recent annual reporting, Rio Tinto’s revenue sources are approximately structured as follows:
- Iron Ore: about 60% — mainly Pilbara iron ore shipments, plus related mining, rail, and port activity.
- Aluminum: about 23% — bauxite, alumina, and primary aluminum operations across multiple regions.
- Copper: about 11% — mined copper and refined products, including major assets such as Kennecott and Oyu Tolgoi.
- Minerals: about 6% — titanium dioxide feedstocks, borates, iron ore company of Canada interests, and other industrial minerals.
This mix shows a company that is diversified across major mined products, but not evenly diversified. Iron ore remains the main profit driver, while aluminum and copper provide additional scale and some protection against weakness in any one commodity.
The long-term earnings pattern has been cyclical rather than steadily rising. Revenue has stayed in a relatively high range in recent years, but margins have moved sharply with commodity prices and operating costs. The broad financial flow still points to a business with strong gross profitability, yet one where earnings can swing meaningfully from year to year depending on market conditions.
The profit profile shows why Rio Tinto is often viewed as a high-quality miner despite cyclical results: even after a weaker period from peak commodity conditions, it has continued to generate substantial operating income and cash flow. The key question is less about survival or balance-sheet stress, and more about how durable those cash flows remain as iron ore prices, project spending, and portfolio changes evolve.
Key Figures
| Metric | Value | Sector ⓘ |
|---|---|---|
| Date | Oct 03, 2026 | |
| Context | ||
| Sector | Basic Materials | |
| Industry | Other Industrial Metals & Mining | |
| Market Cap ⓘ | $153.14B | |
| Beta ⓘ | 0.66 | |
Value (Cheapness) | ||
| P/E Ratio ⓘ | 12.79 | 17.61 |
| P/B Ratio ⓘ | 2.61 | 1.77 |
| FCF Yield ⓘ | 7.16% | 5.87% |
| Dividend Yield ⓘ | 4.93% | 2.06% |
| EBIT / EV ⓘ | 17.22% | 6.43% |
| PEG ⓘ | 5.69 | |
Growth (Business expansion) | ||
| Revenue Growth ⓘ | 15.50% | 11.30% |
| RPS Growth (5Y CAGR) ⓘ | -2.47% | 4.46% |
| EPS Growth (5Y CAGR) ⓘ | -20.34% | -13.11% |
| BVPS Growth (5Y CAGR) ⓘ | 2.63% | 5.51% |
| Margin Growth (5Y Trend) ⓘ | -23.40% | -1.57% |
| FCF Growth (5Y CAGR) ⓘ | -28.02% | 0.55% |
| DPS Growth (5Y CAGR) ⓘ | -20.53% | 6.02% |
Quality (Business durability) | ||
| ROIC (Latest) ⓘ | 27.11% | 9.31% |
| ROA (Latest) ⓘ | 18.90% | 4.94% |
| ROIC (5Y Median) ⓘ | 15.79% | 7.91% |
| ROA (5Y Median) ⓘ | 11.20% | 3.93% |
| Net Debt / EBIT (Latest) ⓘ | 0.47 | 1.40 |
| Net Debt / EBIT (5Y Median) ⓘ | 0.33 | 1.70 |
| Net Debt / EBITDA (Latest) ⓘ | 0.33 | 0.91 |
| Net Debt / Assets ⓘ | 10.44% | 13.69% |
| EBITDA / Interest ⓘ | 22.36 | 11.93 |
| Operating Margin (Latest) ⓘ | 25.41% | 13.07% |
| Operating Margin (5Y Median) ⓘ | 26.07% | 11.86% |
| Debt to Equity (Latest) ⓘ | 34.91% | 40.43% |
| Profit Margin (Latest) ⓘ | 19.58% | 6.57% |
| Free Cash Flow (Latest) ⓘ | $10.97B | |
Momentum (Price trend) | ||
| 3Y Return ⓘ | +76.85% | +65.06% |
| 12M Return (excl. last month) ⓘ | +71.68% | +36.05% |
| 6M Return ⓘ | +3.16% | +1.89% |
| Price vs. 200-Day MA ⓘ | +1.18% | +1.03% |
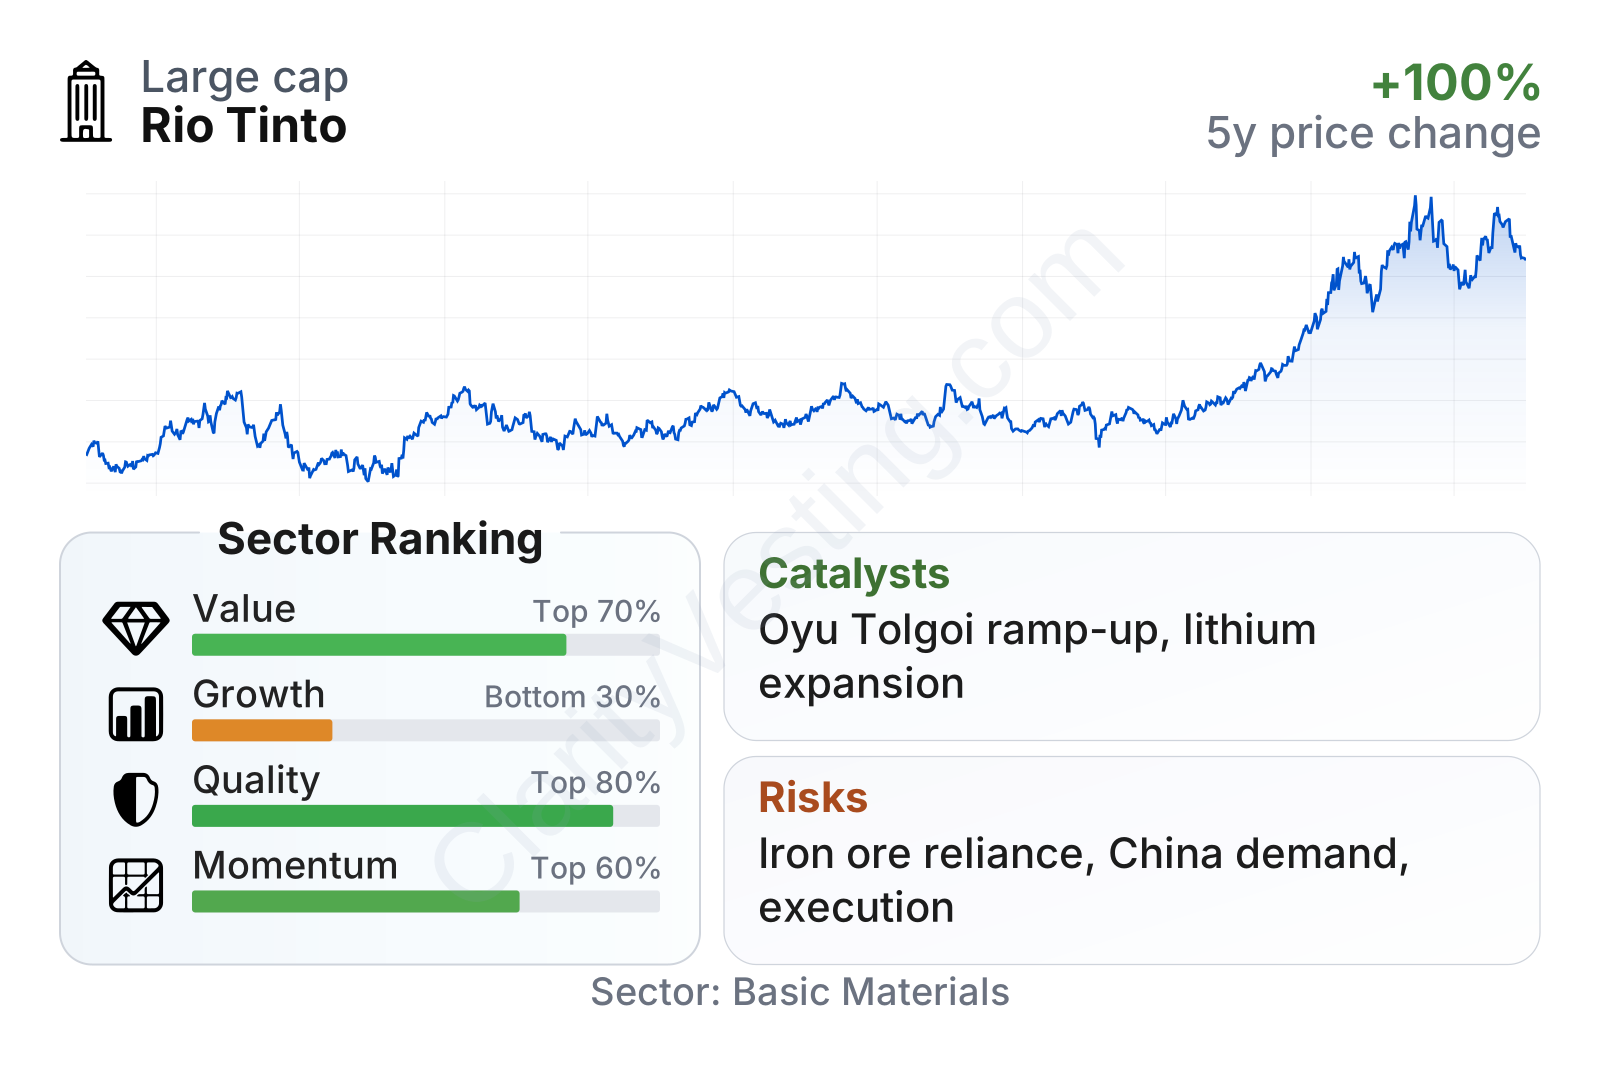
Rio Tinto sits in the large-cap end of the mining sector and its recent profile is mixed in a useful way. On valuation measures, it screens cheaper than much of the sector on earnings and cash flow-based ratios, while its dividend yield is clearly above typical peers. On quality, the company stands out more strongly: returns on capital and assets are well ahead of sector norms, leverage is moderate, and interest coverage is strong. Growth is the weaker area. Recent year-over-year revenue growth has improved, but five-year trends for revenue per share, earnings, free cash flow, and dividends remain soft, reflecting both commodity cycles and uneven profitability after the boom conditions of 2021.
The share price history also illustrates Rio Tinto’s nature as a cyclical global materials company. The stock has delivered strong gains over the past several years, but with significant swings tied to commodity sentiment, China-related demand expectations, and changing views on future supply of iron ore and base metals.
Growth
Rio Tinto operates in a sector with two very different growth profiles. Iron ore is a mature market tied mostly to steel production, infrastructure, and construction. That is not usually a structural high-growth area. Copper and lithium, however, are much more directly exposed to long-term themes such as grid expansion, electric vehicles, renewable energy, batteries, and broader electrification. This means the company’s growth outlook depends less on mining in general and more on whether its portfolio shifts successfully toward these faster-growing materials.
That strategy broadly makes sense. Rio Tinto already has scale, technical expertise, and the balance sheet to fund large projects. Recent company updates have continued to emphasize copper growth through Oyu Tolgoi in Mongolia and lithium expansion following the Arcadium transaction announced in 2024 and completed in 2025. Those moves are important because they reduce dependence on iron ore over time and increase exposure to commodities that could see tighter supply-demand balances in the next decade.
Revenue growth has not been smooth. Recent year-over-year improvement looks better than the sector median, but the longer pattern remains uneven, with multiple periods of contraction over the past few years. That is normal for a miner, yet it also underlines an important point: long-term growth at Rio Tinto is unlikely to come from price alone. It will need to come from production volume growth, new projects, and a better commodity mix.
One of the clearest catalysts is the underground ramp-up at Oyu Tolgoi, one of the world’s most important copper growth assets. As production increases, it could become a more meaningful earnings contributor. Lithium adds another potential leg of expansion. If Rio Tinto executes well, the company could gradually move from being seen mainly as an iron ore producer to a broader supplier of energy-transition materials. That shift would not eliminate cyclicality, but it could improve the quality of growth and diversify the earnings base.
Another favorable point is industry structure. Large, high-quality mining projects are difficult to permit, finance, and build. That creates supply discipline in copper and lithium over the long run. For established operators with access to infrastructure and capital, that can become a durable advantage when demand rises faster than new supply.
Risks
This article is for informational purposes only and does not constitute financial advice. Some content is AI-generated. See Disclaimer


