Stock Analysis · Ryman Healthcare Limited (RHCGF)
Overview
Ryman Healthcare Limited is a New Zealand-based operator and developer of retirement villages, rest homes, and aged-care facilities. The company focuses on older residents who want a combination of independent living, assisted living, and higher-care services in one community. Its footprint is concentrated in New Zealand and Australia, with New Zealand still the core market.
The business model is different from a standard nursing home operator because Ryman combines real estate development, resident accommodation, and healthcare services. That means earnings can be influenced not only by occupancy and care fees, but also by development activity, resale margins on units, and movements in property values.
Based on recent annual reporting, revenue is mainly generated from three broad sources:
- Care and village services: approximately 60% to 70% of revenue. This includes rest-home care, hospital-level care, dementia care, serviced apartments, and ongoing village fees paid by residents.
- Deferred management fees and resident-related income: approximately 15% to 25%. This comes from contractual fees tied to occupation rights and resident turnover within villages.
- Development, resale, and other property-related income: approximately 10% to 20%. This includes gains and proceeds linked to new units, resale activity, and other property operations.
That mix matters because it gives Ryman exposure to both recurring operating income and the housing and property cycle. In strong property markets, the model can be highly profitable. In weaker periods, earnings can become much more volatile than those of a pure healthcare provider.
The recent profit flow shows that revenue has continued to rise, but profitability has been under pressure from high operating costs, elevated interest expense, and weak bottom-line results. The business is still producing large revenue volumes, yet the gap between sales and profit has widened compared with earlier years.
Key Figures
| Metric | Value | Sector ⓘ |
|---|---|---|
| Date | Oct 17, 2026 | |
| Context | ||
| Sector | Healthcare | |
| Industry | Medical Care Facilities | |
| Market Cap ⓘ | $1.14B | |
| Beta ⓘ | 0.37 | |
Value (Cheapness) | ||
| P/E Ratio ⓘ | N/A | 24.79 |
| P/B Ratio ⓘ | 0.24 | 3.08 |
| FCF Yield ⓘ | 34.56% | 3.15% |
| Dividend Yield ⓘ | N/A | 1.94% |
| EBIT / EV ⓘ | -26.29% | 0.57% |
| PEG ⓘ | 2.35 | |
Growth (Business expansion) | ||
| Revenue Growth ⓘ | 11.90% | 7.45% |
| RPS Growth (5Y CAGR) ⓘ | -4.38% | 8.61% |
| EPS Growth (5Y CAGR) ⓘ | -11.07% | -17.81% |
| BVPS Growth (5Y CAGR) ⓘ | -2.51% | 3.72% |
| Margin Growth (5Y Trend) ⓘ | N/A | -0.62% |
| FCF Growth (5Y CAGR) ⓘ | 3.76% | 1.04% |
| DPS Growth (5Y CAGR) ⓘ | -11.71% | 6.77% |
Quality (Business durability) | ||
| ROIC (Latest) ⓘ | N/A | 3.24% |
| ROA (Latest) ⓘ | -8.91% | 3.01% |
| ROIC (5Y Median) ⓘ | -0.24% | 4.60% |
| ROA (5Y Median) ⓘ | 0.04% | 1.89% |
| Net Debt / EBIT (Latest) ⓘ | N/A | 1.34 |
| Net Debt / EBIT (5Y Median) ⓘ | N/A | 1.84 |
| Net Debt / EBITDA (Latest) ⓘ | N/A | 1.00 |
| Net Debt / Assets ⓘ | 12.90% | 5.45% |
| EBITDA / Interest ⓘ | N/A | 9.64 |
| Operating Margin (Latest) ⓘ | -23.86% | 9.27% |
| Operating Margin (5Y Median) ⓘ | -2.22% | 7.38% |
| Debt to Equity (Latest) ⓘ | 39.04% | 28.58% |
| Profit Margin (Latest) ⓘ | -20.05% | 3.59% |
| Free Cash Flow (Latest) ⓘ | $393.17M | |
Momentum (Price trend) | ||
| 3Y Return ⓘ | -70.87% | +42.80% |
| 12M Return (excl. last month) ⓘ | +3.14% | +18.50% |
| 6M Return ⓘ | -30.62% | +7.57% |
| Price vs. 200-Day MA ⓘ | -28.63% | +5.12% |
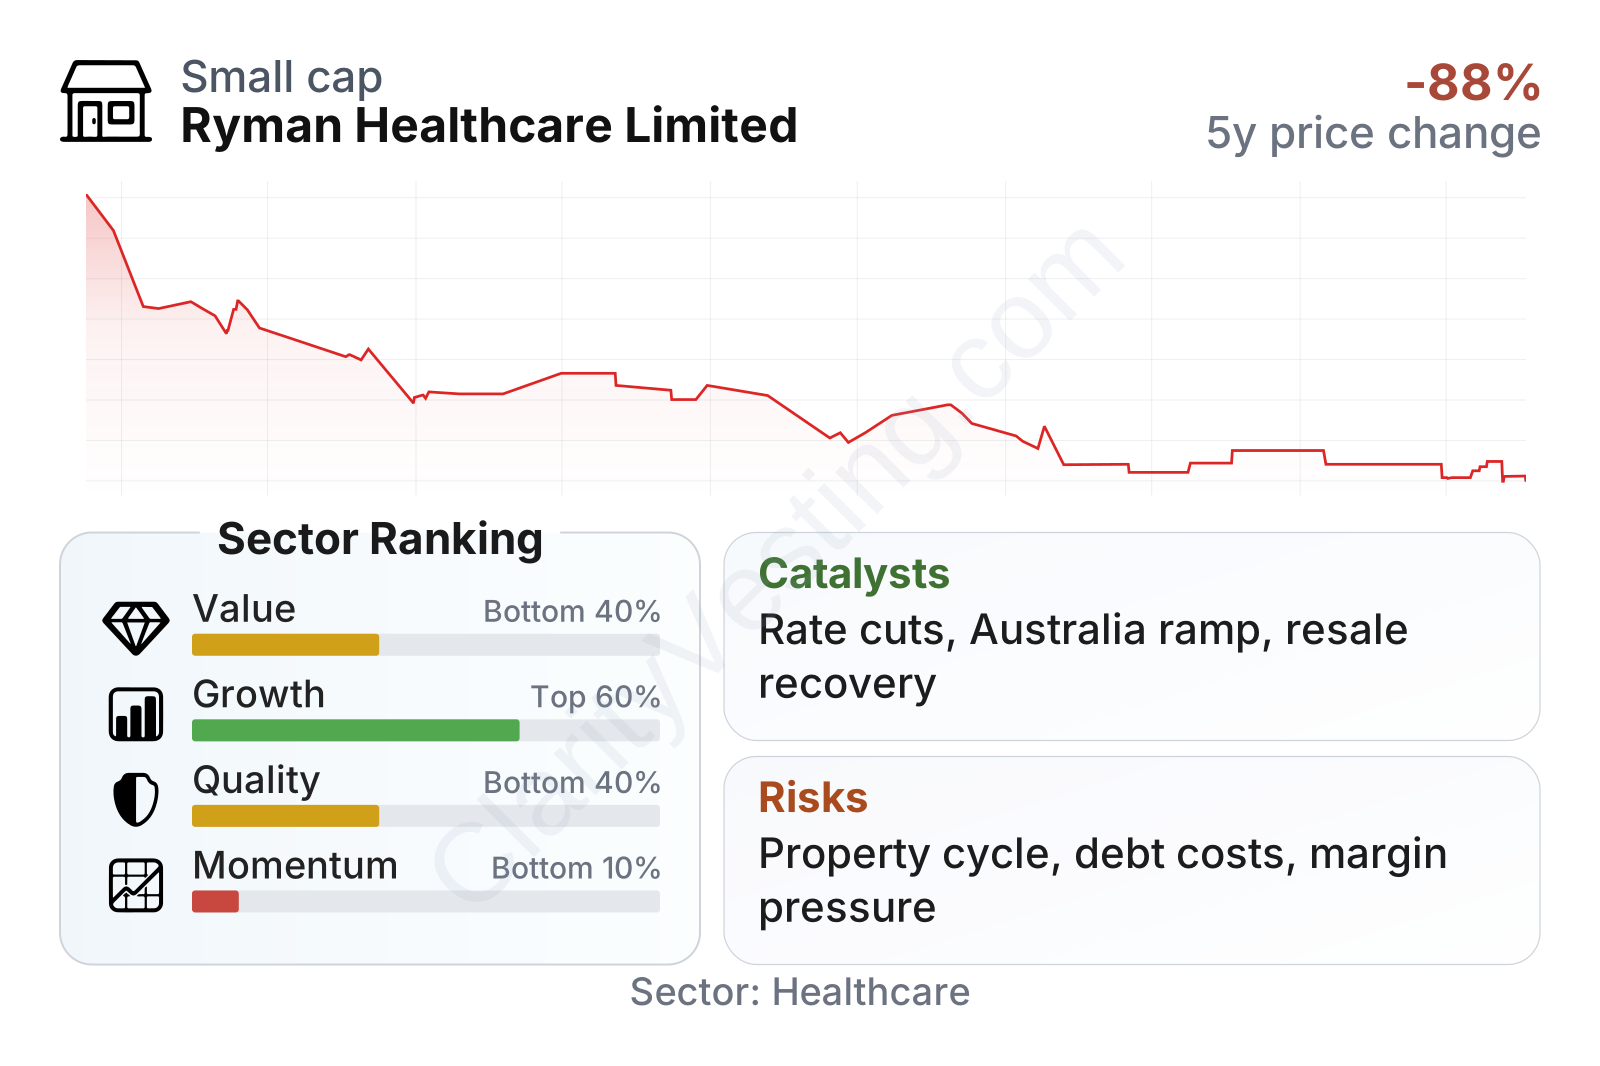
Ryman is now a mid-sized company by market value and its share price behavior has been relatively low-volatility, with a beta well below 1. That lower beta does not mean low risk, however. The weak momentum profile and the large drop from 2021 levels show that the market has been reassessing the company’s earnings power, balance-sheet pressure, and exposure to property conditions.
The metrics table points to a mixed picture. Growth indicators are around the middle of the healthcare sector and recent revenue growth is ahead of the sector median, which suggests the core business is still expanding. At the same time, quality measures are weak: profitability is negative, returns on assets are below the sector median, and leverage is somewhat higher than typical peers. Value measures look optically cheap, especially on price-to-book and free-cash-flow yield, but those signals need caution because they sit alongside negative margins and depressed earnings quality.
Growth
Ryman operates in a sector with a strong long-term demographic tailwind. New Zealand and Australia both have aging populations, and demand for retirement living and aged care is expected to rise over time. That creates a supportive backdrop for operators that can add capacity, maintain occupancy, and fund new projects without overstretching the balance sheet.
The company’s strategy still makes industrial sense. Ryman has an established brand in retirement communities, a long development pipeline, and an integrated model that can keep residents within the same network as their care needs increase. This continuity can help occupancy, resident retention, and operating efficiency over time.
A further growth driver is the Australian expansion. If new villages mature well, Australia could become a more meaningful contributor over the next several years. That matters because it gives Ryman an additional market beyond its home base and expands the runway for new projects.
The clearest catalyst is any improvement in the property and financing environment. Lower interest rates, firmer housing turnover, and better resale conditions can lift cash flow, unit settlements, and margins. Ryman’s model is especially sensitive to those variables because resident inflows and resales are important to capital recycling.
Recent company updates have also emphasized capital discipline, construction pacing, and efforts to strengthen cash generation. In the current phase, progress is less about rapid expansion and more about getting existing assets to deliver steadier returns while preserving financial flexibility.
Risks
This article is for informational purposes only and does not constitute financial advice. Some content is AI-generated. See Disclaimer


