Stock Analysis · Regencell Bioscience Holdings Ltd (RGC)
Overview
Regencell Bioscience Holdings Ltd is a very small healthcare company focused on traditional Chinese medicine-based formulas aimed at neurological and neurocognitive conditions, especially attention deficit hyperactivity disorder and autism spectrum disorder. The company presents itself as an early-stage bioscience business, but financially it still looks more like a development-stage enterprise than a commercial pharmaceutical company.
A key point for long-term analysis is that Regencell has not yet built a normal operating business with recurring sales. Its public filings show no reported revenue in recent fiscal years, which means the company is still trying to turn research, practitioner networks, and brand positioning into a commercial model.
Based on the latest public filings, the revenue mix is currently very limited:
- Product and service revenue: 0% — recent annual filings show no recognized revenue, so there is no meaningful breakdown by geography, product line, or customer type.
- Other operating inflows: not meaningful as revenue — the company has funded operations mainly through capital rather than through sales of treatments or licensed products.
That makes Regencell unusual even among small healthcare names: the business proposition is tied to future commercialization, not current demand already visible in the income statement.
The operating picture has improved in one narrow sense: annual losses and operating expenses have been reduced over the last several years. Selling, general and administrative expense has come down materially, and research spending has also declined. That lowers cash burn, but it does not solve the central issue that the company still has no revenue base.
The financial flow highlights a business that has consistently posted zero revenue while gradually cutting expenses and net losses. The cost base is smaller than it was a few years ago, but the company remains dependent on future commercialization rather than current operating cash generation.
Key Figures
| Metric | Value | Sector ⓘ |
|---|---|---|
| Date | Oct 24, 2026 | |
| Context | ||
| Sector | Healthcare | |
| Industry | Drug Manufacturers - Specialty & Generic | |
| Market Cap ⓘ | $5.36B | |
| Beta ⓘ | 1.17 | |
Value (Cheapness) | ||
| P/E Ratio ⓘ | N/A | 25.42 |
| P/B Ratio ⓘ | 363.54 | 3.08 |
| FCF Yield ⓘ | -0.22% | 3.12% |
| Dividend Yield ⓘ | N/A | 1.85% |
| EBIT / EV ⓘ | -0.52% | 0.56% |
| PEG ⓘ | N/A | |
Growth (Business expansion) | ||
| Revenue Growth ⓘ | N/A | 7.50% |
| RPS Growth (5Y CAGR) ⓘ | N/A | 8.60% |
| EPS Growth (5Y CAGR) ⓘ | N/A | -17.73% |
| BVPS Growth (5Y CAGR) ⓘ | -5.94% | 3.72% |
| Margin Growth (5Y Trend) ⓘ | N/A | -0.57% |
| FCF Growth (5Y CAGR) ⓘ | N/A | 0.96% |
| DPS Growth (5Y CAGR) ⓘ | 1.04% | 6.69% |
Quality (Business durability) | ||
| ROIC (Latest) ⓘ | N/A | 3.17% |
| ROA (Latest) ⓘ | -137.66% | 2.98% |
| ROIC (5Y Median) ⓘ | -34.02% | 4.56% |
| ROA (5Y Median) ⓘ | -50.50% | 1.87% |
| Net Debt / EBIT (Latest) ⓘ | N/A | 1.34 |
| Net Debt / EBIT (5Y Median) ⓘ | N/A | 1.86 |
| Net Debt / EBITDA (Latest) ⓘ | N/A | 1.00 |
| Net Debt / Assets ⓘ | -94.35% | 5.06% |
| EBITDA / Interest ⓘ | N/A | 9.55 |
| Operating Margin (Latest) ⓘ | N/A | 9.25% |
| Operating Margin (5Y Median) ⓘ | N/A | 7.33% |
| Debt to Equity (Latest) ⓘ | 2.22% | 26.68% |
| Profit Margin (Latest) ⓘ | N/A | 3.34% |
| Free Cash Flow (Latest) ⓘ | -$11.70M | |
Momentum (Price trend) | ||
| 3Y Return ⓘ | +2091.69% | +51.61% |
| 12M Return (excl. last month) ⓘ | -59.65% | +19.90% |
| 6M Return ⓘ | -66.51% | +10.10% |
| Price vs. 200-Day MA ⓘ | -46.07% | +6.44% |
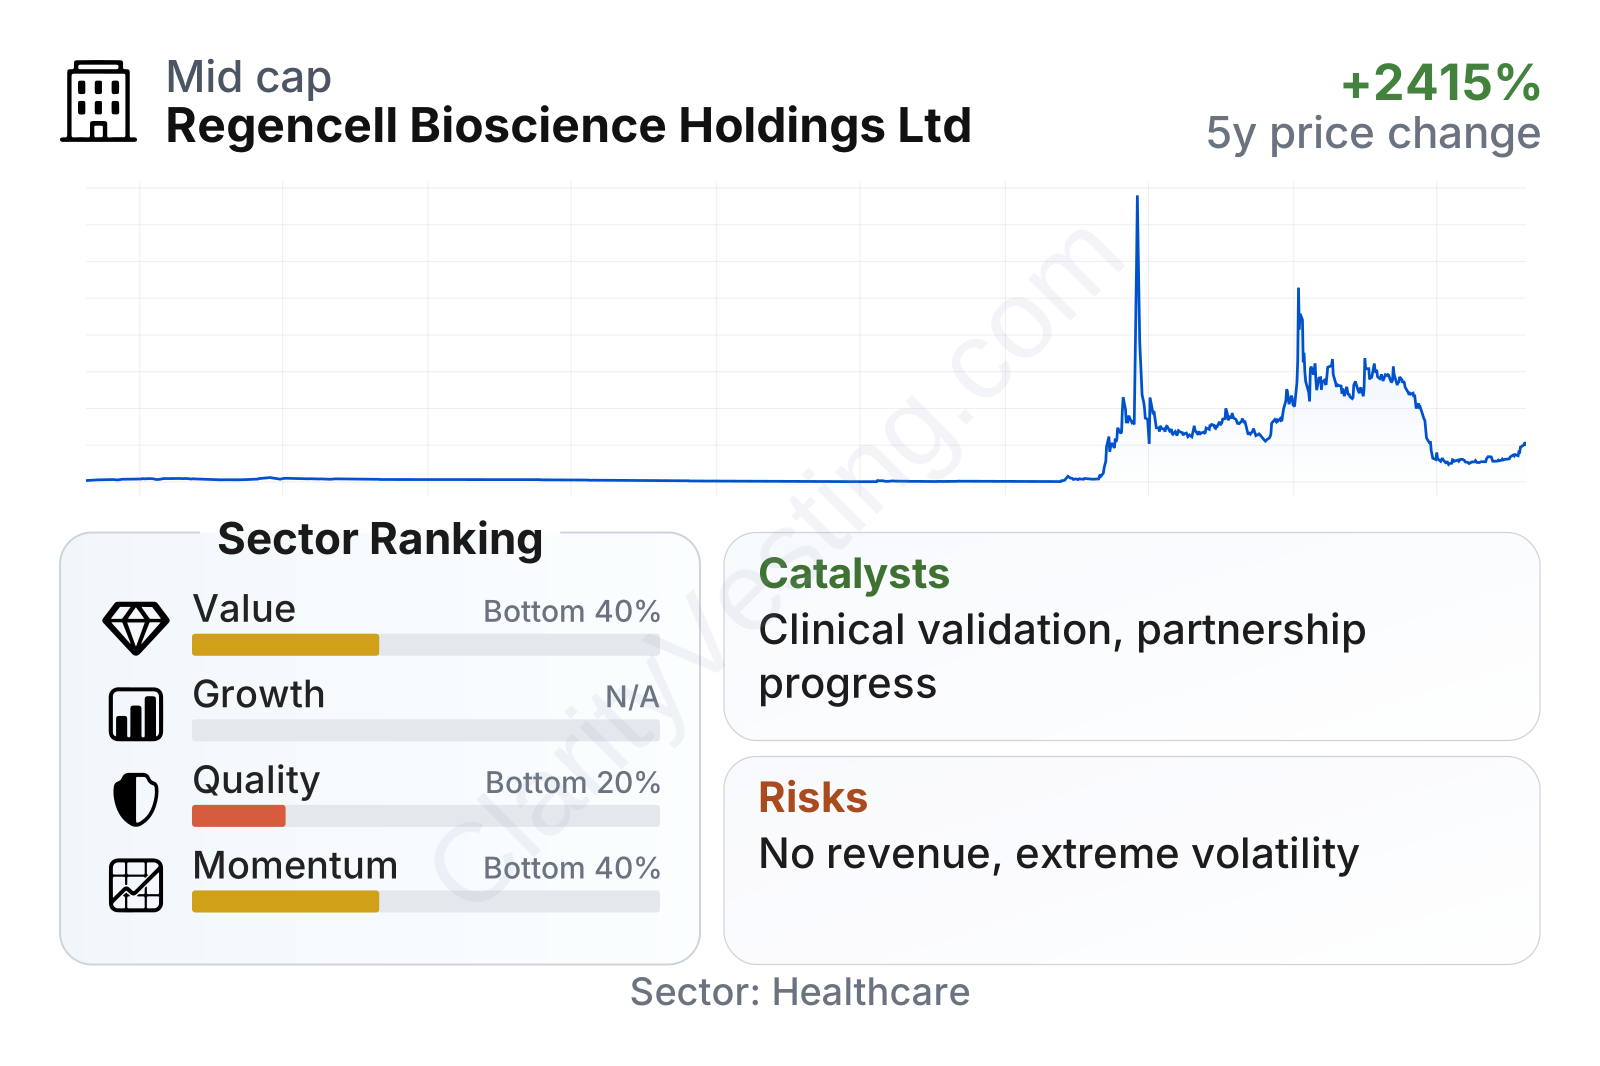
The overall profile is highly unusual. On valuation, the company screens as expensive by conventional measures, especially on price-to-book, while cash flow remains negative. On quality, it ranks near the bottom of the healthcare group because profitability and returns on assets are deeply negative. Growth metrics are hard to interpret because there is no revenue base to measure from. Price behavior has also been extreme: the stock produced a massive multi-year surge and then a very sharp pullback, leaving recent momentum well below the sector median despite the earlier run-up.
In plain terms, the market value is large relative to the current operating business, the balance sheet is not heavily debt-funded, and the share price has been exceptionally volatile.
Growth
Regencell operates in a broad healthcare market where demand for treatments addressing ADHD, autism spectrum disorder, and related neurological conditions is significant and likely to remain important over time. That gives the company exposure to a medically relevant area with long-term need. However, being in an attractive therapeutic category is not enough on its own. The main question is whether Regencell can convert that demand backdrop into approved, trusted, and monetizable products.
The strategic logic is easy to understand at a high level: the company is trying to position traditional Chinese medicine formulations as alternatives or complements for difficult neurological conditions. If it can produce convincing clinical evidence, secure a credible regulatory path, and build practitioner or patient adoption, the commercial opportunity could become much more tangible. For now, though, the strategy is still at an early proof stage rather than a scaling stage.
One constructive sign is that the company has reduced its annual operating loss over time, which can extend the runway if spending remains disciplined. Another positive element is that Regencell has maintained visibility around its treatment approach and clinical ambitions rather than abandoning the program after early-stage setbacks.
The most meaningful future catalysts are therefore not tied to current revenue expansion, but to validation events: progress in clinical development, clearer commercialization plans, possible partnerships, and any evidence that the company can move from concept to monetizable healthcare offerings. Without one of those steps, growth remains mostly theoretical.
Risks
This article is for informational purposes only and does not constitute financial advice. Some content is AI-generated. See Disclaimer


