Stock Analysis · Reinet Investments S.C.A (REVNF)
Overview
Reinet Investments S.C.A. is an investment holding company. In simple terms, it does not operate factories, stores, or consumer brands directly. Instead, it owns stakes in other businesses and investment funds, and its value depends mainly on how those holdings perform over time. The company is listed in Luxembourg and is best known for its large exposure to Pension Insurance Corporation Group, a specialist insurer in the U.K. pension risk transfer market.
For long-term readers, the most important point is that Reinet is closer to a listed investment vehicle than a traditional operating company. Its reported earnings can swing sharply from one year to another because the value of its investments changes with markets, insurance assumptions, and portfolio valuations. That makes headline profit less stable than the underlying net asset value of the portfolio.
Based on recent annual disclosures, Reinet’s economic exposure is highly concentrated. Its main sources of value and investment income are approximately:
- Pension Insurance Corporation Group: about 85% to 90% of net asset value in recent reporting periods. This is a U.K. insurer focused on pension buy-ins and buyouts, where corporate pension liabilities are transferred to an insurer.
- Other investments: about 10% to 15% combined. This bucket includes fund investments, minority holdings, and cash or liquidity reserves, depending on the reporting date.
- Cash and liquid resources: usually a low single-digit to around 10% share of assets depending on realizations and distributions; the exact level can move meaningfully between reporting dates.
This structure means Reinet’s long-term case is tied much more to capital allocation and the performance of a few major holdings than to broad business diversification. It also means the market often compares the share price with the company’s book value or net asset value rather than with sales or operating profit in the way it would assess a normal industrial business.
The flow of income over recent years shows how volatile reported results can be. Reinet has posted very strong gains in some years and large negative movements in others, which is typical for an investment company whose portfolio is revalued regularly. Operating costs themselves remain relatively modest compared with the size of the asset base, so the main driver is investment performance rather than overhead.
Key Figures
| Metric | Value | Sector ⓘ |
|---|---|---|
| Date | Oct 24, 2026 | |
| Context | ||
| Sector | Financial Services | |
| Industry | Asset Management | |
| Market Cap ⓘ | $4.56B | |
| Beta ⓘ | 0.46 | |
Value (Cheapness) | ||
| P/E Ratio ⓘ | N/A | 12.46 |
| P/B Ratio ⓘ | 0.72 | 1.25 |
| FCF Yield ⓘ | 8.70% | 9.82% |
| Dividend Yield ⓘ | 1.73% | 2.94% |
| EBIT / EV ⓘ | N/A | 8.11% |
| PEG ⓘ | N/A | |
Growth (Business expansion) | ||
| Revenue Growth ⓘ | 770.20% | 9.10% |
| RPS Growth (5Y CAGR) ⓘ | N/A | 12.31% |
| EPS Growth (5Y CAGR) ⓘ | -9.69% | -6.97% |
| BVPS Growth (5Y CAGR) ⓘ | 3.27% | 5.02% |
| Margin Growth (5Y Trend) ⓘ | 94.48% | -4.00% |
| FCF Growth (5Y CAGR) ⓘ | 9.86% | 4.71% |
| DPS Growth (5Y CAGR) ⓘ | 10.26% | 8.92% |
Quality (Business durability) | ||
| ROIC (Latest) ⓘ | N/A | 9.18% |
| ROE (Latest) ⓘ | 8.31% | 13.93% |
| ROA (Latest) ⓘ | 8.31% | 1.57% |
| ROIC (5Y Median) ⓘ | N/A | 7.80% |
| ROE (5Y Median) ⓘ | 8.72% | 12.15% |
| ROA (5Y Median) ⓘ | 8.72% | 1.28% |
| Net Debt / EBIT (Latest) ⓘ | N/A | 1.02 |
| Net Debt / EBIT (5Y Median) ⓘ | N/A | 0.72 |
| Net Debt / EBITDA (Latest) ⓘ | N/A | 0.88 |
| Operating Margin (Latest) ⓘ | N/A | 22.30% |
| Operating Margin (5Y Median) ⓘ | 103.45% | 24.50% |
| Debt to Equity (Latest) ⓘ | N/A | 59.34% |
| Profit Margin (Latest) ⓘ | N/A | 26.42% |
| Free Cash Flow (Latest) ⓘ | $397.01M | |
Momentum (Price trend) | ||
| 3Y Return ⓘ | +37.07% | +95.73% |
| 12M Return (excl. last month) ⓘ | +13.79% | +17.30% |
| 6M Return ⓘ | -19.10% | +6.07% |
| Price vs. 200-Day MA ⓘ | N/A | +5.36% |
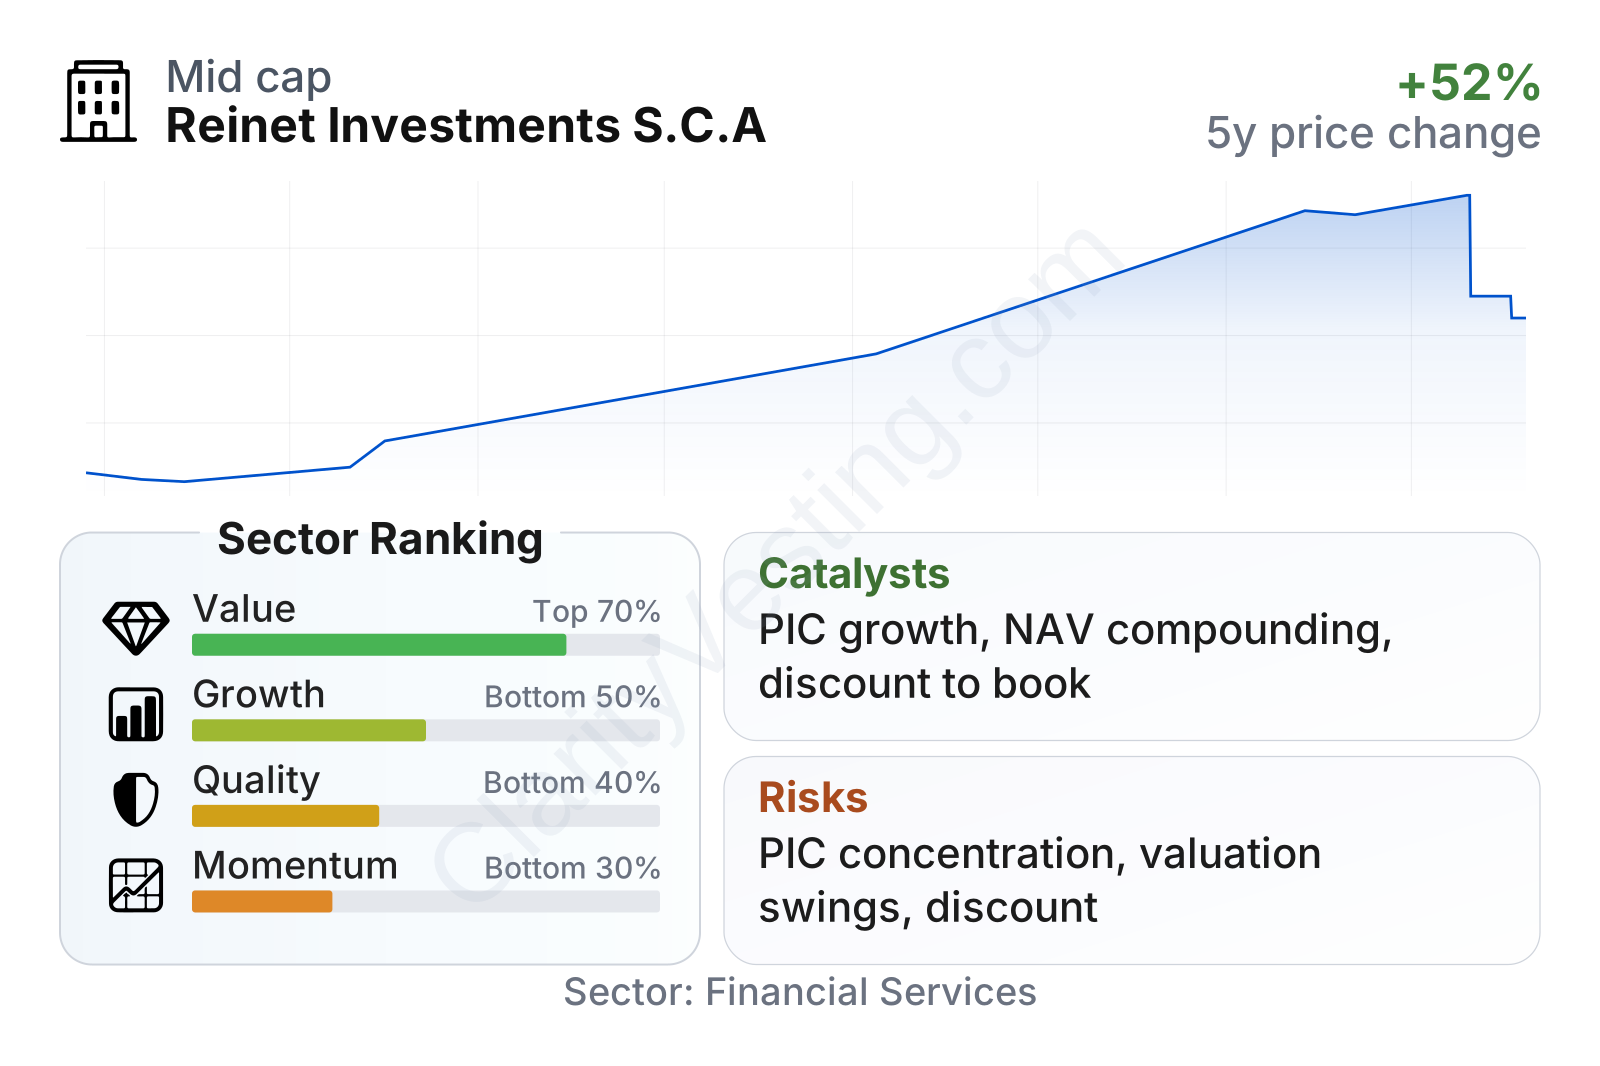
Reinet is a mid-sized listed investment company with a low beta of about 0.46, suggesting the share has historically moved less than the broader market. On valuation, the shares trade at roughly 0.75x book value, below the sector median near 1.21x, which points to a discount to balance-sheet value. Cash generation is solid, with free cash flow yield around 8.7%, although the dividend yield of about 1.7% is below the sector median.
Growth metrics are mixed. Revenue growth appears unusually strong on a year-over-year basis, but that number is less useful here because investment gains and valuation movements can distort it. Over a longer period, book value per share has increased, though more slowly than the sector median, while earnings per share have been uneven. Quality indicators also need careful interpretation: returns on assets are strong, but return on equity is below the sector median, and profit margin is not very meaningful for a company whose results depend heavily on unrealized gains and losses.
Momentum has been weaker than much of the sector. The share price has had positive multi-year performance, but recent shorter-term trading has lagged. For a company like Reinet, that often reflects changing sentiment around its main holdings and the persistent discount between market price and underlying asset value.
Growth
Reinet’s main growth engine is Pension Insurance Corporation, and that places the company in a part of financial services with a credible long-term tailwind. In the U.K., many defined-benefit pension plans are looking to reduce risk and transfer liabilities to insurers. As interest rates have improved funding levels for many pension schemes, the market for pension buy-ins and buyouts has expanded. That creates a favorable backdrop for specialist insurers with capital, underwriting expertise, and the ability to source large transactions.
If that market continues to develop, Reinet can benefit indirectly through the growth in the value of its stake in PIC. The strategic logic is straightforward: rather than trying to build a broad collection of unrelated holdings, Reinet has kept its biggest exposure in a niche where scale, regulatory expertise, and long-duration asset management matter. That focus increases concentration risk, but it also gives the portfolio a clearer path to compounding if PIC continues to win business.
The earnings pattern still requires caution. Recent earnings per share moved into negative territory, which underlines how accounting results can reverse quickly when portfolio valuations weaken. For Reinet, EPS is not a smooth indicator of business progress, so it is more useful as a sign of volatility than as a clean measure of operating momentum.
Book value per share has generally trended upward over the last several years, even with a pullback in the latest period. That is important because book value is one of the clearest ways to track whether the underlying portfolio is compounding over time. The longer-term increase suggests value creation has continued despite periodic drawdowns.
A relevant recent development is the latest annual reporting for the year ended March 2026, which showed a decline in net asset value and a net loss driven largely by valuation movements. At the same time, Reinet’s core structure has not changed: the company still has meaningful exposure to a major insurer operating in a market with structural demand. So the near-term setback does not by itself change the longer-term rationale, but it does remind readers that progress will not be linear.
Risks
This article is for informational purposes only and does not constitute financial advice. Some content is AI-generated. See Disclaimer


