Stock Analysis · RPC Inc (RES)
Overview
RPC Inc. is a U.S. oilfield services company. It does not primarily produce oil or gas itself. Instead, it provides services and equipment that help exploration and production companies drill wells, complete them, and keep them operating. Its activity is tied closely to spending by North American shale producers, especially in onshore U.S. basins.
The business is organized into two main segments. Based on the latest annual filing, revenue is heavily concentrated in pressure pumping, with a much smaller contribution from a group of support services.
- Technical Services — approximately 82% of revenue: this is mainly pressure pumping, including hydraulic fracturing services used to stimulate wells, plus related completion support. This is the engine of the company and the part most exposed to changes in U.S. well completion activity and pricing.
- Support Services — approximately 18% of revenue: this segment includes coiled tubing, downhole tools, snubbing, rental tools, nitrogen, fishing, wireline, and pumpdown services. These activities support drilling, completion, and maintenance work and give RPC a broader service offering, but they are still much smaller than pressure pumping.
Geographically, RPC is overwhelmingly tied to the United States, which keeps the business simple to understand but also means it has limited diversification if U.S. land activity weakens.
The financial flow over the last several years shows a business that can produce strong revenue in good markets, but with profits that swing sharply as service pricing and utilization change. Revenue recovered strongly in 2022 and stayed elevated afterward, yet earnings and operating income have fallen materially from their cycle highs as margins compressed.
Key Figures
| Metric | Value | Sector ⓘ |
|---|---|---|
| Date | Oct 17, 2026 | |
| Context | ||
| Sector | Energy | |
| Industry | Oil & Gas Equipment & Services | |
| Market Cap ⓘ | $1.35B | |
| Beta ⓘ | 0.86 | |
Value (Cheapness) | ||
| P/E Ratio ⓘ | 55.18 | 15.44 |
| P/B Ratio ⓘ | 1.19 | 1.73 |
| FCF Yield ⓘ | 2.90% | 8.20% |
| Dividend Yield ⓘ | 2.68% | 3.59% |
| EBIT / EV ⓘ | 4.21% | 7.46% |
| PEG ⓘ | 16.77 | |
Growth (Business expansion) | ||
| Revenue Growth ⓘ | 9.50% | 26.90% |
| RPS Growth (5Y CAGR) ⓘ | 16.24% | 6.90% |
| EPS Growth (5Y CAGR) ⓘ | -44.80% | -15.73% |
| BVPS Growth (5Y CAGR) ⓘ | 13.56% | 6.07% |
| Margin Growth (5Y Trend) ⓘ | 3.04% | 0.58% |
| FCF Growth (5Y CAGR) ⓘ | N/A | 1.86% |
| DPS Growth (5Y CAGR) ⓘ | 40.93% | 16.79% |
Quality (Business durability) | ||
| ROIC (Latest) ⓘ | 0.51% | 11.40% |
| ROA (Latest) ⓘ | 1.54% | 6.06% |
| ROIC (5Y Median) ⓘ | 6.89% | 10.30% |
| ROA (5Y Median) ⓘ | 6.77% | 5.42% |
| Net Debt / EBIT (Latest) ⓘ | -2.59 | 1.64 |
| Net Debt / EBIT (5Y Median) ⓘ | -1.93 | 1.83 |
| Net Debt / EBITDA (Latest) ⓘ | -0.58 | 1.08 |
| Net Debt / Assets ⓘ | -8.74% | 17.29% |
| EBITDA / Interest ⓘ | 38.52 | 9.64 |
| Operating Margin (Latest) ⓘ | 2.75% | 16.27% |
| Operating Margin (5Y Median) ⓘ | 6.31% | 20.39% |
| Debt to Equity (Latest) ⓘ | 4.68% | 54.76% |
| Profit Margin (Latest) ⓘ | 1.28% | 8.82% |
| Free Cash Flow (Latest) ⓘ | $39.07M | |
Momentum (Price trend) | ||
| 3Y Return ⓘ | -27.41% | +67.38% |
| 12M Return (excl. last month) ⓘ | +40.23% | +49.19% |
| 6M Return ⓘ | -9.21% | +7.07% |
| Price vs. 200-Day MA ⓘ | -5.21% | +9.56% |
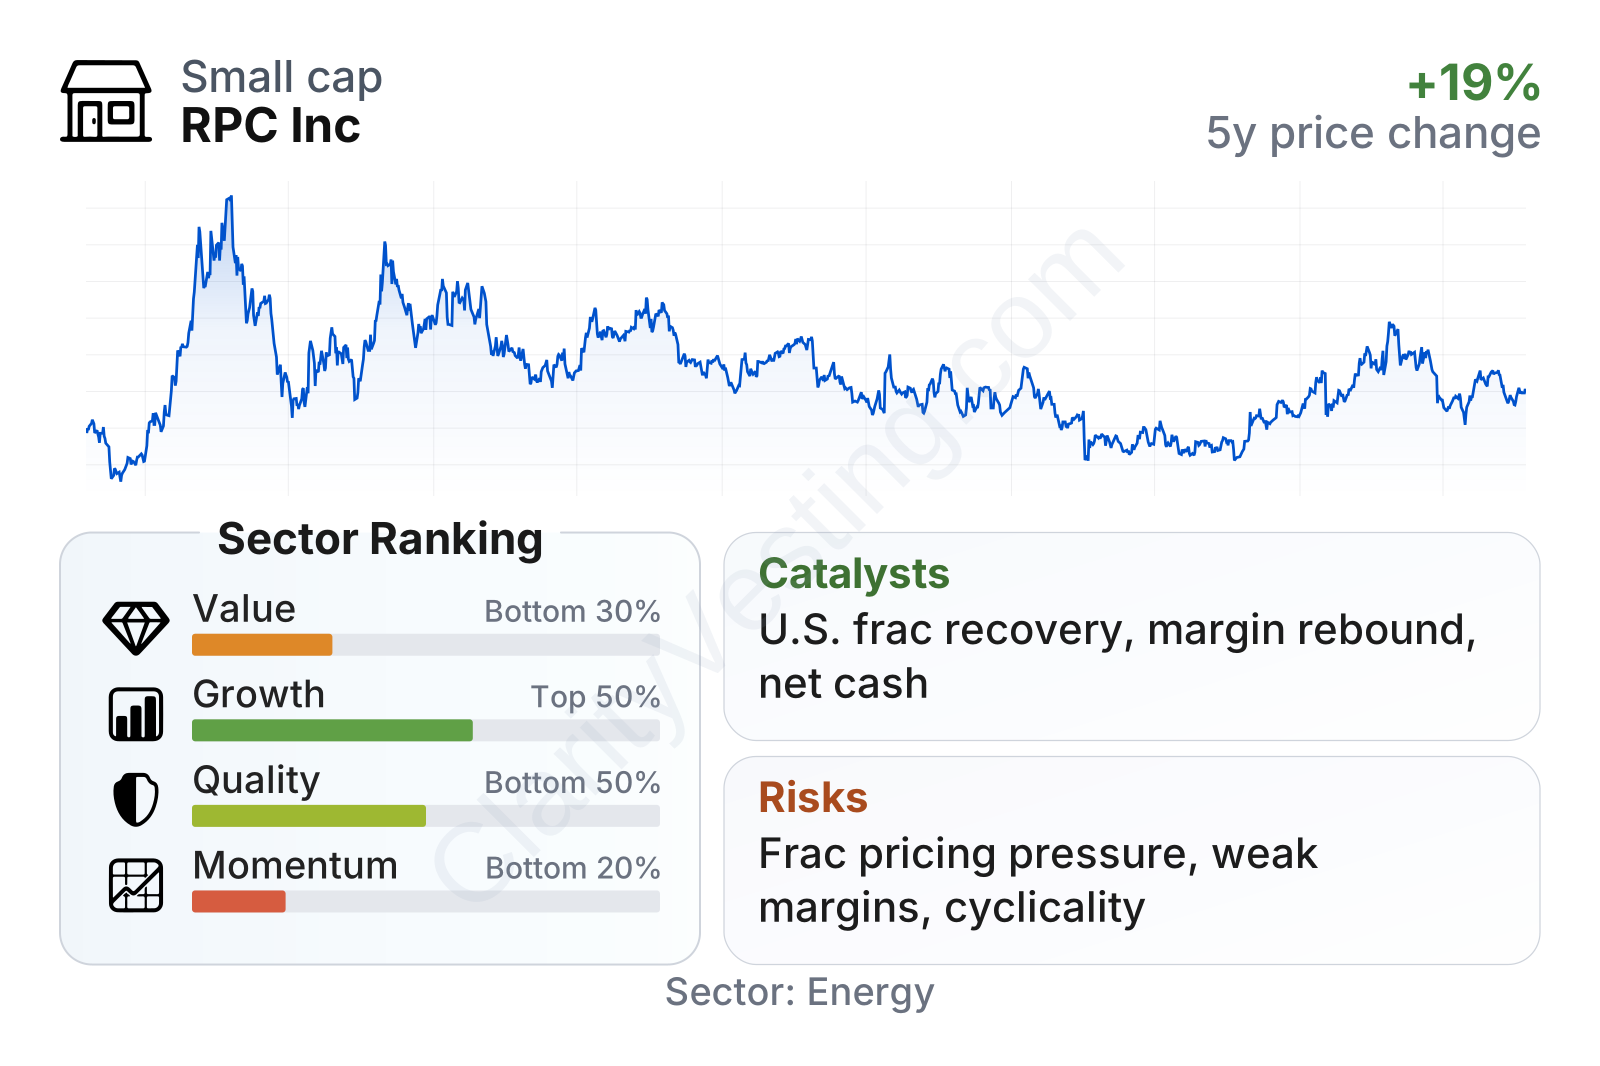
RPC is a small-cap company in the energy services space. The current profile is mixed: growth measures sit around the middle of the sector, but quality, value, and momentum rank lower. The company’s balance sheet stands out positively, with very low leverage and net cash, while profitability and cash generation have weakened meaningfully from stronger periods. That combination often leads to a stock that looks financially safe but operationally cyclical.
Growth
RPC operates in a sector that still has long-term relevance, but it is not a straightforward secular growth industry. Demand depends on oil and natural gas prices, producer budgets, drilling intensity, and completion activity. In practical terms, this means the company can grow quickly during upcycles, but those gains can reverse when customers cut spending or when too much service capacity pressures pricing.
Its strategy is sensible for this industry. RPC focuses on service lines that are essential to shale development, especially pressure pumping, while keeping a broad menu of complementary services around the wellsite. That helps customer relationships and creates some cross-selling potential. The challenge is that the company remains highly concentrated in pressure pumping, which is one of the most competitive and price-sensitive parts of oilfield services.
Recent revenue trends show this cyclicality clearly. The company posted explosive year-over-year growth during the 2022 recovery, then moved through a period of contraction, and more recently returned to positive growth. The latest pace is still below the sector median, suggesting RPC is participating in the market but not leading it.
Cash generation tells a similar story. Free cash flow turned strongly positive after the downturn period, but the trailing level has come down substantially from earlier highs. That does not erase the improvement from the weak years, but it does indicate that the current operating environment is less favorable than it was during the post-pandemic surge.
The most meaningful catalysts are tied to industry conditions rather than a single company-specific breakthrough. A stronger U.S. completion market, firmer pressure pumping pricing, better fleet utilization, and higher demand for natural gas-related development would all support results. Management has also emphasized disciplined capital spending and shareholder returns in recent years, which can help preserve balance sheet strength if the market remains uneven.
One additional point in RPC’s favor is that scale is not its only path to growth. Because it has a relatively clean balance sheet, the company has room to keep investing in equipment upgrades, maintenance, and selective opportunities without the financial strain seen at more indebted peers.
Risks
This article is for informational purposes only and does not constitute financial advice. Some content is AI-generated. See Disclaimer


