Stock Analysis · Reelcause Inc (RCIT)
Overview
Reelcause Inc is classified in the specialty industrial machinery space, but the publicly available operating and financial information currently visible is unusually limited for a company with a very large quoted market value. Based on the available regulatory and market data, the business appears to be at an early or highly undeveloped operating stage rather than a mature industrial equipment producer with established revenue streams.
That matters for long-term analysis because the central question is not only what the company might become, but also whether there is enough verifiable evidence today to understand how it makes money, how durable that model is, and whether current market expectations are grounded in operating results.
Recent public financial information does not provide a clear, reliable breakdown of revenue by business line. In practice, that means the main sources of revenue cannot be ranked with confidence from largest to smallest based on the material currently available through standard public company disclosures. The lack of segment visibility is itself an important point for readers: when revenue composition is unclear, it becomes harder to judge resilience, customer concentration, and the quality of future growth.
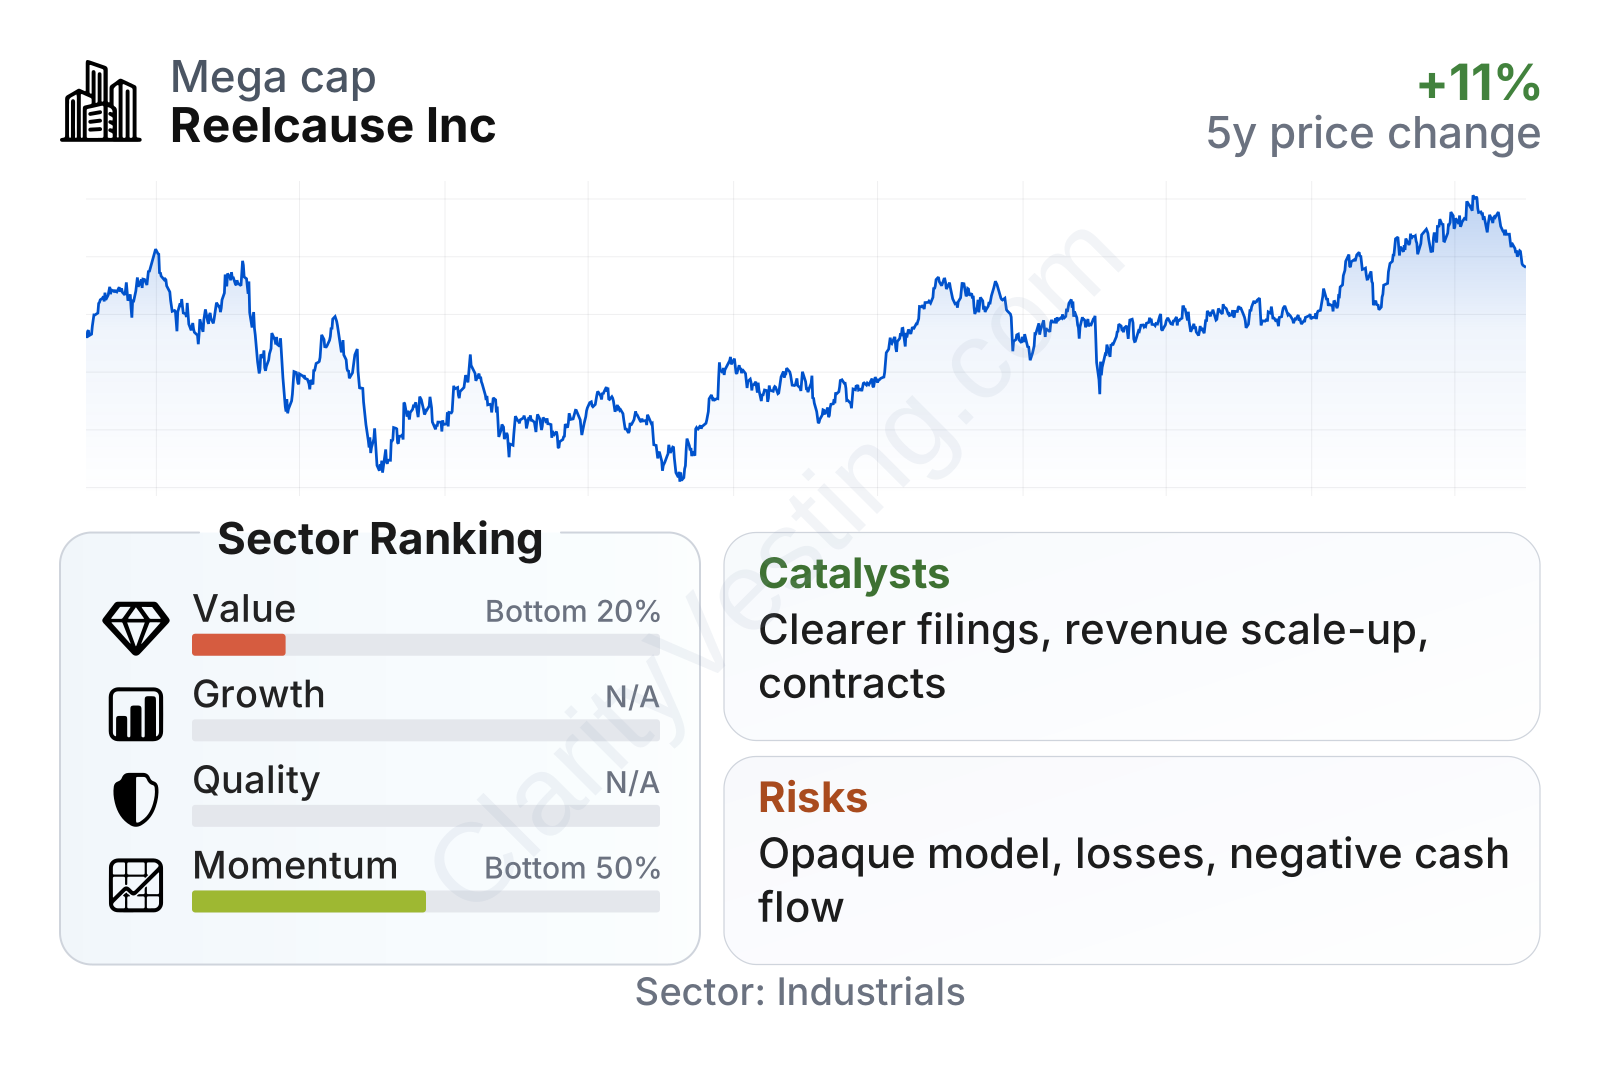
The limited financial trail that is visible points more clearly to expenses and losses than to recurring commercial activity. Over the last reported years in the available operating flow, losses widened materially and operating expenses absorbed the economic activity that can be observed. That does not automatically rule out future potential, but it does mean the present investment case depends heavily on developments that have not yet shown up clearly in audited operating performance.
The operating flow shown over recent years suggests a business that has not yet established stable profitability. Instead of revenue expanding into operating income and then net income, the pattern points to persistent losses and a cost base that remains difficult to absorb at the current scale of activity.
Key Figures
| Metric | Value | Sector ⓘ |
|---|---|---|
| Date | Oct 03, 2026 | |
| Context | ||
| Sector | Industrials | |
| Industry | Specialty Industrial Machinery | |
| Market Cap ⓘ | $295.78B | |
| Beta ⓘ | 1.48 | |
Value (Cheapness) | ||
| P/E Ratio ⓘ | N/A | 22.45 |
| P/B Ratio ⓘ | N/A | 1.98 |
| FCF Yield ⓘ | -0.00% | 6.31% |
| Dividend Yield ⓘ | N/A | 1.96% |
| EBIT / EV ⓘ | N/A | 4.81% |
| PEG ⓘ | N/A | |
Growth (Business expansion) | ||
| Revenue Growth ⓘ | 5.00% | 9.10% |
| RPS Growth (5Y CAGR) ⓘ | N/A | 7.75% |
| EPS Growth (5Y CAGR) ⓘ | N/A | -13.59% |
| BVPS Growth (5Y CAGR) ⓘ | N/A | 6.22% |
| Margin Growth (5Y Trend) ⓘ | N/A | 0.72% |
| FCF Growth (5Y CAGR) ⓘ | N/A | 10.98% |
| DPS Growth (5Y CAGR) ⓘ | N/A | 9.48% |
Quality (Business durability) | ||
| ROIC (Latest) ⓘ | N/A | 10.92% |
| ROA (Latest) ⓘ | N/A | 5.41% |
| ROIC (5Y Median) ⓘ | N/A | 9.21% |
| ROA (5Y Median) ⓘ | -84629.24% | 4.94% |
| Net Debt / EBIT (Latest) ⓘ | N/A | 2.07 |
| Net Debt / EBIT (5Y Median) ⓘ | N/A | 2.28 |
| Net Debt / EBITDA (Latest) ⓘ | N/A | 1.43 |
| Net Debt / Assets ⓘ | N/A | 19.27% |
| EBITDA / Interest ⓘ | N/A | 9.53 |
| Operating Margin (Latest) ⓘ | N/A | 10.50% |
| Operating Margin (5Y Median) ⓘ | N/A | 10.27% |
| Debt to Equity (Latest) ⓘ | N/A | 65.48% |
| Profit Margin (Latest) ⓘ | N/A | 6.62% |
| Free Cash Flow (Latest) ⓘ | -$151.08K | |
Momentum (Price trend) | ||
| 3Y Return ⓘ | +37.05% | +58.56% |
| 12M Return (excl. last month) ⓘ | +13.03% | +15.63% |
| 6M Return ⓘ | +6.17% | +4.19% |
| Price vs. 200-Day MA ⓘ | -1.57% | +0.93% |
The market value places Reelcause among larger listed companies by size, but the underlying operating profile shown here looks much weaker than that headline would suggest. On valuation measures, the company ranks in the bottom 20% of its sector, largely because free cash flow is negative and traditional value anchors are hard to apply when earnings quality is thin or absent.
Growth also looks modest in the most recent yearly comparison. Revenue increased about 5%, below the sector median of about 9%. Profitability is especially weak: profit margin is at 0% versus a sector median near 7%, and free cash flow remains negative. On market performance, the shares have advanced over the last three years, but less than the sector median over that period, while recent trading sits roughly around the long-term average rather than clearly above it.
Growth
The broader industrial machinery sector can offer attractive long-term growth when companies are tied to automation, efficiency upgrades, electrification, or specialized production tools. Those themes remain relevant across manufacturing. However, for Reelcause specifically, the challenge is that the available public record does not yet show a well-documented operating platform that clearly connects the company to those growth themes in a measurable way.
A sensible long-term growth strategy in this industry would normally include a visible order pipeline, product differentiation, repeat customers, margin progression, and evidence that scale is improving economics. At the moment, public numbers point to only limited top-line growth and ongoing losses, so the strategic case appears much more dependent on future execution than on already-demonstrated business momentum.
The strongest possible catalysts would likely come from developments that make the company easier to analyze fundamentally: a clearer business description, audited revenue expansion, commercial contracts of meaningful size, improving cash generation, or a marked reduction in operating losses. Without that kind of evidence, the growth case remains more speculative than operationally proven.
No major public-domain 2026 operating breakthrough appears clearly established in the materials reviewed here. That absence is important by itself. In long-term analysis, a company does not need constant news flow, but when visibility is already low, the lack of concrete business milestones reduces confidence in forecasting future scale.
Risks
This article is for informational purposes only and does not constitute financial advice. Some content is AI-generated. See Disclaimer