Stock Analysis · RBC Bearings Incorporated (RBC)
Overview
RBC Bearings Incorporated is a manufacturer of highly engineered bearings, motion-control components, and related precision parts used in demanding applications. In simple terms, its products help machines rotate, move, guide, and handle stress reliably. The company sells into markets where failure is costly, including aerospace, defense, industrial equipment, transportation, factory automation, and energy-related applications.
The business is organized around two main segments. The largest is industrial, which serves a wide range of equipment makers and aftermarket customers. The second is aerospace and defense, where RBC supplies bearings and specialized components for aircraft, helicopters, engines, missiles, and military platforms. The product line also includes couplings, shafts, seals, cam followers, rod ends, spherical plain bearings, and precision metal components.
Based on the latest annual mix reported by the company, revenue is mainly generated from the following sources:
- Industrial segment: approximately 61% of revenue. This includes bearings and precision components used in general industrial machinery, mining, construction equipment, rail, energy, semiconductor equipment, and other heavy-duty or specialty applications.
- Aerospace/Defense segment: approximately 39% of revenue. This includes aircraft bearings, engine and airframe components, defense-platform parts, and other highly specified products for commercial aerospace and military customers.
That mix matters because it gives RBC exposure to both recurring industrial demand and longer-cycle aerospace programs. The company’s portfolio is focused on niche, high-performance parts rather than commodity hardware, which usually supports better pricing and customer stickiness.
The financial flow over recent years points to a business that has not only expanded sales, but also improved profitability as scale increased. Revenue has risen steadily since 2022, while operating income and net income have grown faster than sales, suggesting better cost absorption and stronger product mix.
Key Figures
| Metric | Value | Sector ⓘ |
|---|---|---|
| Date | Oct 03, 2026 | |
| Context | ||
| Sector | Industrials | |
| Industry | Tools & Accessories | |
| Market Cap ⓘ | $15.89B | |
| Beta ⓘ | 1.40 | |
Value (Cheapness) | ||
| P/E Ratio ⓘ | 49.80 | 22.45 |
| P/B Ratio ⓘ | 4.57 | 1.98 |
| FCF Yield ⓘ | 2.42% | 6.31% |
| Dividend Yield ⓘ | N/A | 1.96% |
| EBIT / EV ⓘ | 2.76% | 4.81% |
| PEG ⓘ | 1.65 | |
Growth (Business expansion) | ||
| Revenue Growth ⓘ | 19.20% | 9.10% |
| RPS Growth (5Y CAGR) ⓘ | 14.40% | 7.75% |
| EPS Growth (5Y CAGR) ⓘ | -16.20% | -13.59% |
| BVPS Growth (5Y CAGR) ⓘ | 5.17% | 6.22% |
| Margin Growth (5Y Trend) ⓘ | 9.65% | 0.72% |
| FCF Growth (5Y CAGR) ⓘ | 22.83% | 10.98% |
| DPS Growth (5Y CAGR) ⓘ | N/A | 9.48% |
Quality (Business durability) | ||
| ROIC (Latest) ⓘ | 8.38% | 10.92% |
| ROA (Latest) ⓘ | 6.22% | 5.41% |
| ROIC (5Y Median) ⓘ | 6.93% | 9.21% |
| ROA (5Y Median) ⓘ | 4.48% | 4.94% |
| Net Debt / EBIT (Latest) ⓘ | 1.64 | 2.07 |
| Net Debt / EBIT (5Y Median) ⓘ | 3.59 | 2.28 |
| Net Debt / EBITDA (Latest) ⓘ | 1.28 | 1.43 |
| Net Debt / Assets ⓘ | 14.50% | 19.27% |
| EBITDA / Interest ⓘ | 12.32 | 9.53 |
| Operating Margin (Latest) ⓘ | 23.46% | 10.50% |
| Operating Margin (5Y Median) ⓘ | 21.82% | 10.27% |
| Debt to Equity (Latest) ⓘ | 25.36% | 65.48% |
| Profit Margin (Latest) ⓘ | 16.40% | 6.62% |
| Free Cash Flow (Latest) ⓘ | $385.20M | |
Momentum (Price trend) | ||
| 3Y Return ⓘ | +113.23% | +58.56% |
| 12M Return (excl. last month) ⓘ | +26.75% | +15.63% |
| 6M Return ⓘ | -8.08% | +4.19% |
| Price vs. 200-Day MA ⓘ | -9.00% | +0.93% |
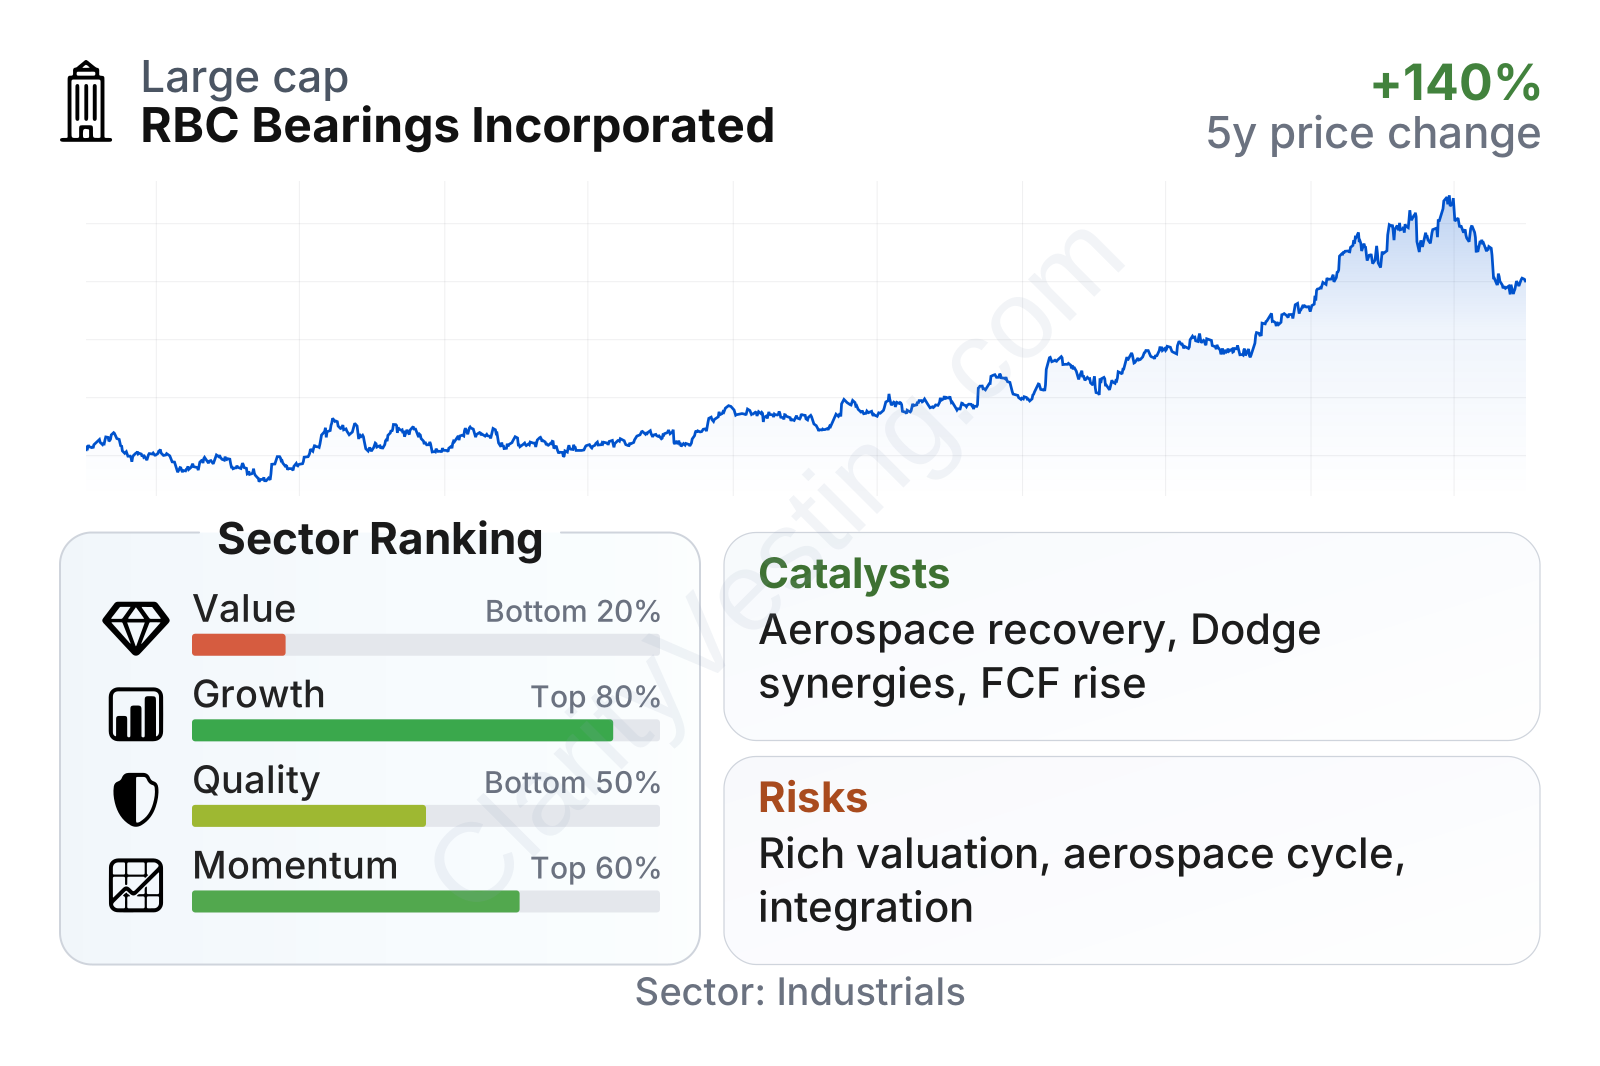
RBC is now a large industrial company by market value, but its profile is unusual versus many peers. Growth and margins stand out positively, while valuation looks much richer than the sector median. Quality is mixed rather than weak: returns on capital are not top-tier, but debt is moderate, interest coverage is solid, and operating profitability is well above most companies in the sector. Price momentum has been strong over several years, although the shares have cooled somewhat in the more recent period.
Growth
RBC operates in attractive long-term markets. Aerospace and defense benefit from multi-year aircraft build cycles, fleet maintenance needs, and military spending. Industrial demand is broader and more cyclical, but the company is positioned in specialized applications where customers often prioritize reliability and engineering support over price alone. That creates a better backdrop than in more commoditized parts markets.
The strategy also makes sense. RBC has spent years building a portfolio of niche components with demanding certification, qualification, and replacement requirements. This tends to create long product lives and repeat orders. The company has also used acquisitions to broaden its catalog and customer reach, with the Dodge acquisition in recent years materially increasing its industrial scale. The integration benefits are increasingly visible in margin improvement and cash generation.
Recent revenue growth has accelerated again into the high-teens range, which is well above the sector median. That is important because it suggests RBC is not relying only on cost cuts or accounting effects to lift earnings. It is still finding real demand, especially as aerospace production gradually improves and industrial channels remain supported by a wider installed base.
Cash generation adds to the growth case. Free cash flow has climbed sharply over the last several years and recently moved into the mid-hundreds of millions of dollars. Stronger cash conversion gives RBC more flexibility to reduce debt, fund capacity, pursue bolt-on acquisitions, and support long program cycles without straining the balance sheet.
A current catalyst is the continued normalization of commercial aerospace production and aftermarket activity. RBC is deeply tied to components that benefit not only from new aircraft builds but also from fleet utilization and maintenance. Defense demand is another support, especially where qualification barriers limit supplier turnover. On the industrial side, broader cross-selling opportunities from the larger post-acquisition product portfolio could continue to lift revenue per customer.
Risks
This article is for informational purposes only and does not constitute financial advice. Some content is AI-generated. See Disclaimer


