Stock Analysis · RB Global Inc (RBA)
Overview
RB Global Inc operates marketplaces that help businesses buy and sell commercial assets. Its best-known activities are industrial auctions, vehicle remarketing, and equipment marketplaces. In simple terms, the company connects sellers that want to dispose of trucks, heavy equipment, cars, parts, or surplus inventory with buyers looking for those assets. It runs both digital and on-site channels, earns service fees around those transactions, and also provides related services such as inspections, logistics, financing support, and data tools.
The company became much larger and more diversified after combining with IAA, which expanded its presence in vehicle salvage and insurance-related auto auctions. Today, RB Global’s business is spread across construction equipment, transportation assets, agriculture machinery, automotive salvage, and other commercial categories. That mix gives it exposure to both normal replacement cycles and distress-driven sales, which can make results more resilient than a single-category marketplace.
Based on recent annual reporting, revenue is mainly generated from service and transaction-based fees tied to marketplace activity, with additional revenue from inventory sales and value-added services. The broad mix can be summarized as follows:
- Automotive salvage and vehicle-related marketplaces: approximately 45% to 50% of revenue. This includes auctions and related services for totaled or damaged vehicles, mainly through the IAA business.
- Commercial construction, transportation, and agriculture equipment marketplaces: approximately 35% to 40% of revenue. This includes commissions and service revenue from selling used heavy equipment, trucks, and other industrial assets, largely through Ritchie Bros. channels.
- Inventory sales and other marketplace activities: approximately 10% to 15% of revenue. This can include proceeds from assets sold from inventory positions as well as certain trading activities.
- Other services: approximately 5% to 10% of revenue. This includes ancillary offerings such as listing services, financing-related support, transportation, inspections, and data products.
One notable feature of the business model is that it is asset-light in its core marketplace activities. The company does not need to manufacture equipment or vehicles; instead, it monetizes transaction volume, buyer relationships, seller relationships, and data. That generally supports healthy margins when volumes are strong.
The long-term picture shows a business that has scaled up meaningfully in recent years, especially after the IAA transaction. Revenue has expanded sharply since 2021, and operating income has also improved, although interest expense rose after the larger balance sheet was taken on to support expansion.
Key Figures
| Metric | Value | Sector ⓘ |
|---|---|---|
| Date | Oct 24, 2026 | |
| Context | ||
| Sector | Industrials | |
| Industry | Specialty Business Services | |
| Market Cap ⓘ | $14.98B | |
| Beta ⓘ | 0.53 | |
Value (Cheapness) | ||
| P/E Ratio ⓘ | 34.87 | 22.29 |
| P/B Ratio ⓘ | 2.53 | 1.98 |
| FCF Yield ⓘ | 4.09% | 6.26% |
| Dividend Yield ⓘ | 1.58% | 1.92% |
| EBIT / EV ⓘ | 3.95% | 4.83% |
| PEG ⓘ | 0.65 | |
Growth (Business expansion) | ||
| Revenue Growth ⓘ | 11.10% | 9.30% |
| RPS Growth (5Y CAGR) ⓘ | 18.40% | 7.76% |
| EPS Growth (5Y CAGR) ⓘ | -3.73% | -13.17% |
| BVPS Growth (5Y CAGR) ⓘ | 35.36% | 6.13% |
| Margin Growth (5Y Trend) ⓘ | -1.26% | 0.74% |
| FCF Growth (5Y CAGR) ⓘ | 27.83% | 10.79% |
| DPS Growth (5Y CAGR) ⓘ | 10.82% | 9.41% |
Quality (Business durability) | ||
| ROIC (Latest) ⓘ | 7.68% | 10.75% |
| ROA (Latest) ⓘ | 3.92% | 5.41% |
| ROIC (5Y Median) ⓘ | 8.41% | 9.37% |
| ROA (5Y Median) ⓘ | 3.64% | 4.95% |
| Net Debt / EBIT (Latest) ⓘ | 3.06 | 2.04 |
| Net Debt / EBIT (5Y Median) ⓘ | 6.36 | 2.27 |
| Net Debt / EBITDA (Latest) ⓘ | 1.81 | 1.39 |
| Net Debt / Assets ⓘ | 19.34% | 19.27% |
| EBITDA / Interest ⓘ | 7.26 | 9.58 |
| Operating Margin (Latest) ⓘ | 16.20% | 10.49% |
| Operating Margin (5Y Median) ⓘ | 17.10% | 10.30% |
| Debt to Equity (Latest) ⓘ | 48.60% | 64.82% |
| Profit Margin (Latest) ⓘ | 9.99% | 6.67% |
| Free Cash Flow (Latest) ⓘ | $612.20M | |
Momentum (Price trend) | ||
| 3Y Return ⓘ | +34.40% | +67.77% |
| 12M Return (excl. last month) ⓘ | -28.70% | +12.05% |
| 6M Return ⓘ | -20.41% | 0.00% |
| Price vs. 200-Day MA ⓘ | -18.07% | +0.67% |
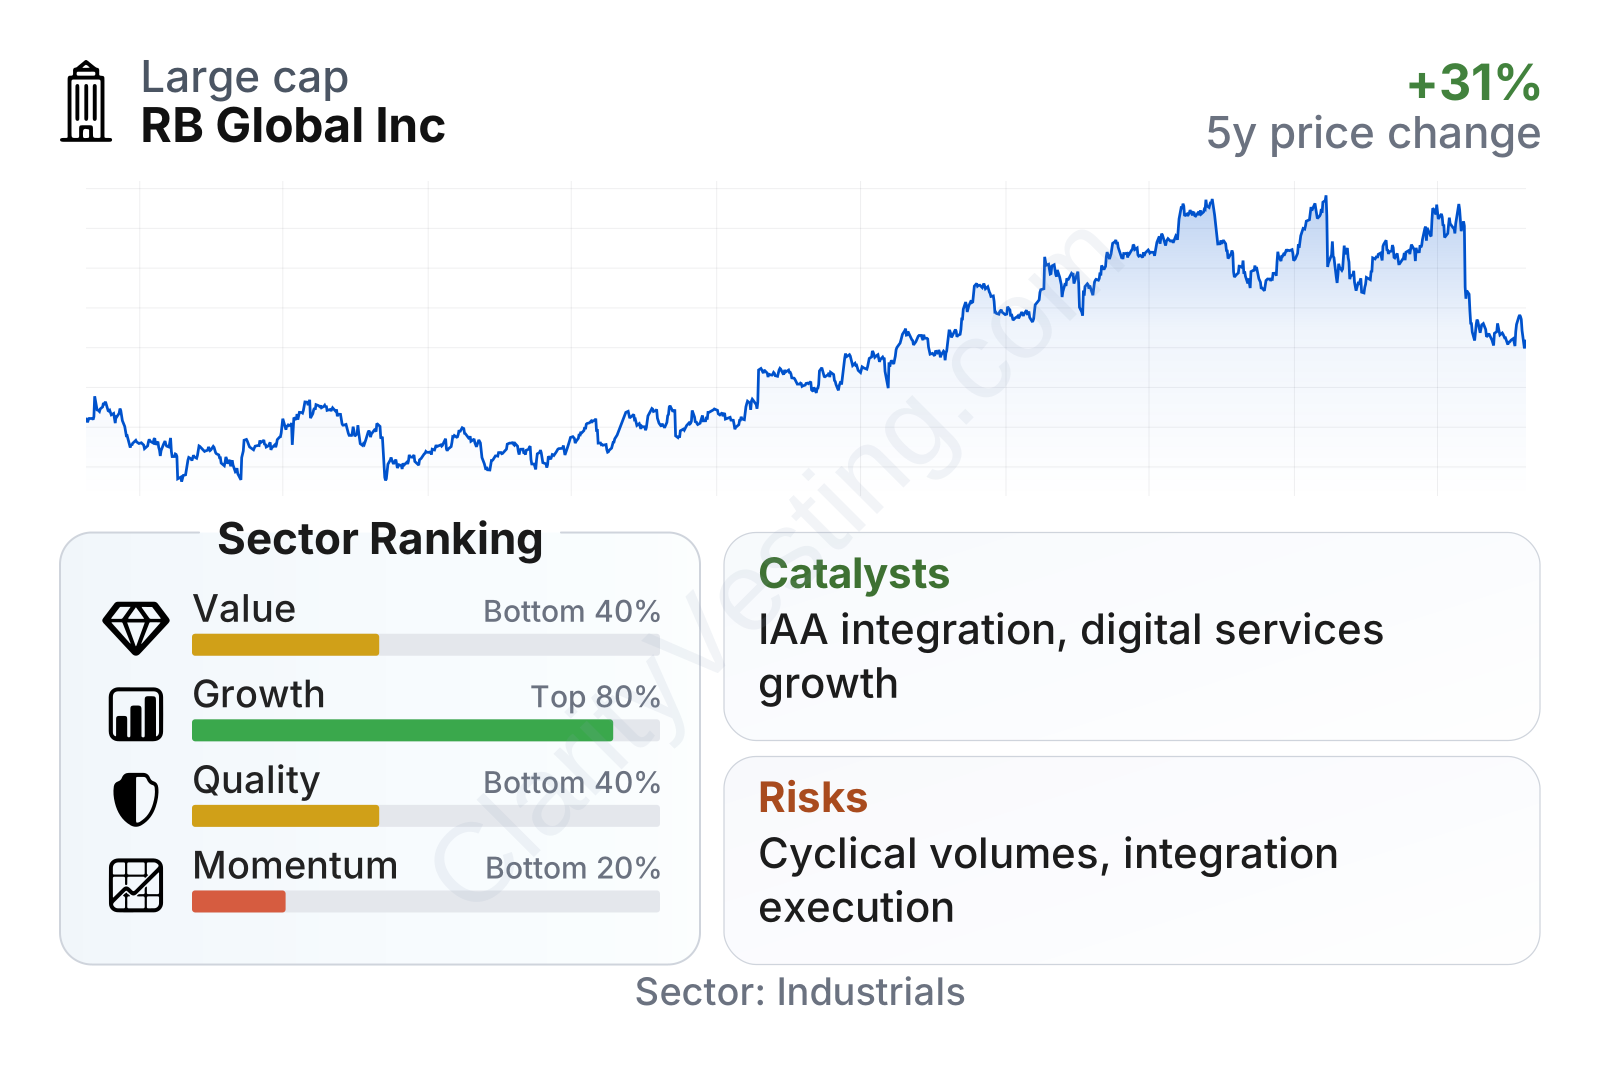
RB Global is a large company within specialty business services, with a relatively low share-price volatility profile. The latest metrics suggest a mixed setup: growth is stronger than much of the sector, while valuation looks richer and balance-sheet quality is more average. Profitability is better than the sector median on operating and net margins, but returns on capital are less impressive, which suggests the company is efficient operationally yet still working through the capital structure and integration effects of past expansion.
Growth
RB Global operates in a sector with durable long-term demand. Used equipment, fleet turnover, salvage vehicles, and surplus industrial assets are recurring parts of the economy. Businesses often prefer secondary-market channels because they are faster, more transparent, and more capital-efficient than buying new assets. That gives the company exposure to a structural trend: more commerce in industrial and automotive assets is moving toward organized digital marketplaces.
The strategy also makes sense. RB Global has been building a broader ecosystem rather than relying only on classic auctions. It now combines multiple sales formats, a large global buyer base, financing and logistics support, and data tools that help sellers maximize recovery values. This can strengthen network effects: more buyers attract more sellers, and more sellers improve inventory depth for buyers.
Revenue growth has normalized after the step-change created by the IAA combination, but the recent pace still looks healthy at around 11% year over year, modestly ahead of the sector median. Over a five-year view, revenue per share has compounded at roughly 18%, which is strong for a marketplace operator of this size. That points to real scale expansion rather than only short-term cyclical noise.
Cash generation is another supportive element. Free cash flow has increased substantially over the last few years and remains in a solid range, with the latest trailing figure above $600 million. A marketplace business that converts earnings into cash has more flexibility to reduce debt, reinvest in technology, pursue bolt-on deals, and keep raising dividends over time.
A meaningful catalyst is the continued integration and optimization of IAA. If the company keeps improving cross-selling, platform efficiency, procurement, and service attachment rates, earnings can rise faster than revenue. Another catalyst is digital adoption: the more transactions shift online and the more participants use value-added services, the greater the revenue opportunity per asset sold.
Recent company communications have also emphasized operational execution, marketplace expansion, and cost discipline. That matters because RB Global does not need a dramatic industry breakthrough to grow; it mainly needs to keep taking share, deepening services, and using its enlarged platform more effectively.
Risks
This article is for informational purposes only and does not constitute financial advice. Some content is AI-generated. See Disclaimer


