Stock Analysis · Cordyceps Sunshine Biotech Holdings Co. Ltd (RAJAF)
Overview
Cordyceps Sunshine Biotech Holdings Co. Ltd is a small packaged-food and health-products company focused on products derived from Cordyceps militaris, a fungus commonly marketed in Asia for wellness, nutrition, and traditional-health uses. Based on its public filings, the business centers on cultivating, developing, and selling cordyceps-related products rather than operating as a broad consumer staples company with multiple large brands.
The company’s revenue base appears concentrated in a narrow product family. Public disclosures indicate that sales mainly come from cordyceps-based consumer products, with limited scale so far and no broad, diversified segment mix comparable to larger food or supplement groups. Detailed 2026 segment percentages are not clearly broken out in the material available, so a precise ranked revenue split by product line cannot be stated with confidence. What is visible is that revenue is generated primarily from:
- Cordyceps-related health and nutrition products — the core commercial activity, including products positioned around wellness and functional consumption.
- Other related product sales and distribution activity — a smaller, less clearly disclosed category tied to the same general cordyceps ecosystem.
The main takeaway is that this is a highly specialized company: its identity, commercial strategy, and future depend heavily on whether a niche cordyceps brand can expand into a larger consumer-health platform.
The financial flow over the last several years shows a business that did achieve a sharp jump in sales from 2022 to 2024, but that revenue growth has not translated into durable profitability. Gross profit remained positive, yet selling and administrative costs expanded enough to keep operating income and net income negative in the most recent years. That pattern matters because it suggests commercialization costs are still outrunning the company’s current scale.
Key Figures
| Metric | Value | Sector ⓘ |
|---|---|---|
| Date | Oct 17, 2026 | |
| Context | ||
| Sector | Consumer Defensive | |
| Industry | Packaged Foods | |
| Market Cap ⓘ | $1.02B | |
| Beta ⓘ | -54.15 | |
Value (Cheapness) | ||
| P/E Ratio ⓘ | N/A | 17.88 |
| P/B Ratio ⓘ | N/A | 1.29 |
| FCF Yield ⓘ | N/A | 12.39% |
| Dividend Yield ⓘ | N/A | 2.85% |
| EBIT / EV ⓘ | N/A | 6.43% |
| PEG ⓘ | N/A | |
Growth (Business expansion) | ||
| Revenue Growth ⓘ | 491.90% | 4.10% |
| RPS Growth (5Y CAGR) ⓘ | N/A | 6.18% |
| EPS Growth (5Y CAGR) ⓘ | N/A | -13.59% |
| BVPS Growth (5Y CAGR) ⓘ | N/A | 3.20% |
| Margin Growth (5Y Trend) ⓘ | N/A | -0.15% |
| FCF Growth (5Y CAGR) ⓘ | -47.32% | 4.10% |
| DPS Growth (5Y CAGR) ⓘ | N/A | 6.79% |
Quality (Business durability) | ||
| ROIC (Latest) ⓘ | N/A | 12.34% |
| ROA (Latest) ⓘ | N/A | 6.30% |
| ROIC (5Y Median) ⓘ | N/A | 10.49% |
| ROA (5Y Median) ⓘ | -4.51% | 5.44% |
| Net Debt / EBIT (Latest) ⓘ | N/A | 1.96 |
| Net Debt / EBIT (5Y Median) ⓘ | N/A | 2.35 |
| Net Debt / EBITDA (Latest) ⓘ | N/A | 1.38 |
| Net Debt / Assets ⓘ | 12.17% | 21.51% |
| EBITDA / Interest ⓘ | N/A | 9.46 |
| Operating Margin (Latest) ⓘ | N/A | 8.87% |
| Operating Margin (5Y Median) ⓘ | -13.00% | 9.53% |
| Debt to Equity (Latest) ⓘ | N/A | 72.35% |
| Profit Margin (Latest) ⓘ | -12.43% | 5.40% |
| Free Cash Flow (Latest) ⓘ | N/A | |
Momentum (Price trend) | ||
| 3Y Return ⓘ | N/A | +20.92% |
| 12M Return (excl. last month) ⓘ | 0.00% | +2.13% |
| 6M Return ⓘ | 0.00% | +1.26% |
| Price vs. 200-Day MA ⓘ | 0.00% | +1.39% |
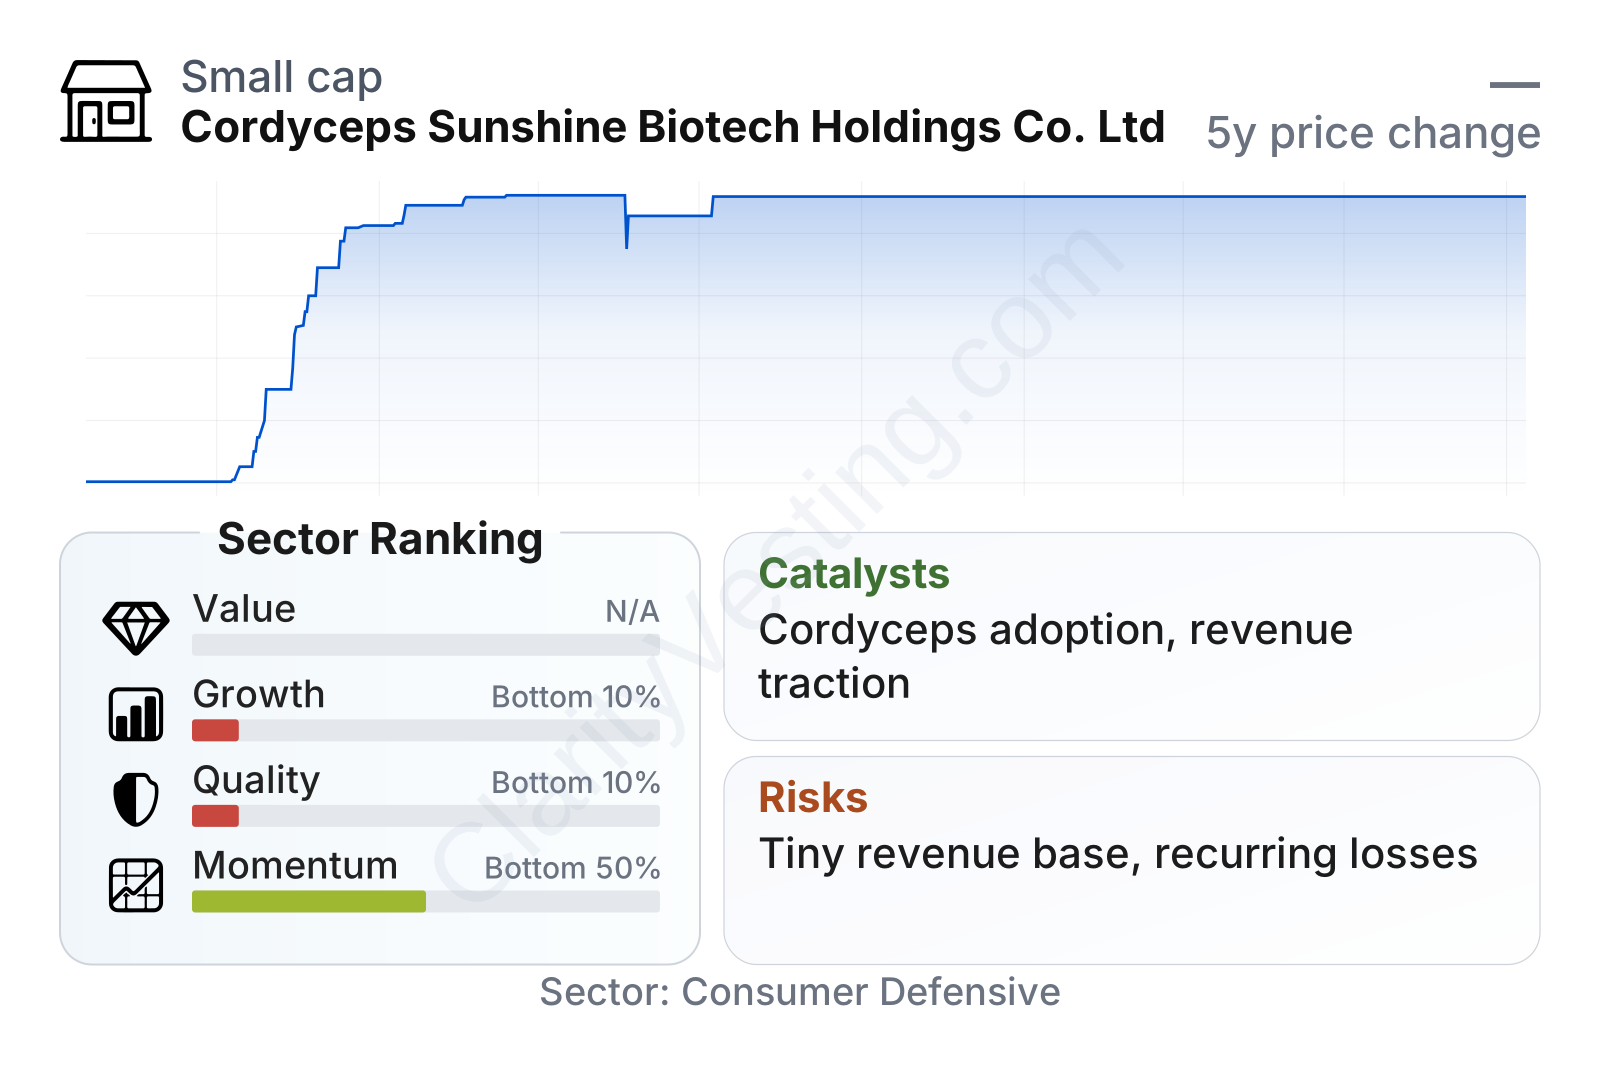
The metrics point to a mixed but mostly weak fundamental profile. Revenue growth looks unusually high on a year-over-year basis, far above the sector median, but that should be read carefully because it comes from a very small starting base. At the same time, the company ranks in the bottom 10% of its sector on both growth and quality overall, with negative profit margin of about 12% and a five-year free-cash-flow trend that has moved sharply lower.
Balance-sheet leverage does not appear to be the central problem. Net debt as a share of assets is around 12%, which is lower than the sector median near 21%. The larger issue is operating efficiency: historical returns on assets and operating margins have been well below normal packaged-food levels. In simple terms, the company is not currently under the most pressure from debt, but from its inability to consistently convert revenue into earnings and cash flow.
The share-price chart also deserves caution. The stock moved from only a few cents in mid-2024 to more than $9 by early 2025 and then stayed almost flat for an extended period. That kind of move is highly unusual relative to normal business progress and makes traditional valuation signals such as P/E less useful, especially since earnings remain negative.
Growth
The broader health, wellness, and functional-food market is a favorable backdrop. Consumer interest in immune support, natural supplements, and specialty nutrition remains real, particularly in Asian markets and among buyers willing to pay for perceived health benefits. In that sense, the company operates in a segment that can grow faster than standard packaged foods.
Its strategy also has a degree of logic: instead of competing across the entire food industry, it is trying to build around a focused ingredient category with cultural recognition and premium-health positioning. If management can establish product credibility, build distribution, and keep customers returning, a niche specialist can sometimes scale faster than a generalist brand.
There are two potential catalysts embedded in the current setup. First, the company has already shown that it can lift revenue from a very low base to above $1 million annually, which at least demonstrates some commercial traction. Second, if cordyceps-based products gain wider acceptance outside narrow specialty channels, the addressable market could expand meaningfully from today’s level.
That said, the recent numbers do not yet show proof of a self-sustaining growth engine. Revenue in 2025 was roughly flat versus 2024, hovering around $1.2 million to $1.3 million, while operating losses persisted. For long-term analysis, growth matters most when it becomes repeatable and profitable; this business has not crossed that threshold yet.
Risks
This article is for informational purposes only and does not constitute financial advice. Some content is AI-generated. See Disclaimer


