Stock Analysis · Qinetiq Group PLC (QNTQY)
Overview
QinetiQ Group PLC is a British defense and security technology company. It develops, tests, and supports systems used by military and government customers, with activities spanning research, robotics, sensors, cyber, training, aircraft and weapons testing, and mission support. In simple terms, QinetiQ helps armed forces and security agencies design equipment, check whether it works in realistic conditions, and improve it over time.
The business is centered on long-term government relationships, especially in the United Kingdom, the United States, and Australia. A large part of its role is not manufacturing mass-market products, but providing specialist know-how, engineering services, and access to highly regulated test environments that are difficult and expensive to replicate.
Based on recent annual reporting, revenue is mainly organized through geographic and operating segments rather than a pure product split. The broad revenue mix can be summarized as follows:
- EMEA Services and Solutions: approximately 55% to 60% of revenue. This includes UK-led defense research, test and evaluation, training, engineering, and mission support.
- Global Solutions (mainly U.S. and Australia): approximately 40% to 45% of revenue. This includes U.S. defense and security services, technology integration, and Australian defense programs.
- Products and higher-value technology offerings: a smaller share within both segments, including robotics, sensors, autonomy, survivability, and other specialist systems. Precise group-wide percentage disclosure is limited because these offerings are embedded within larger service contracts.
The business model is attractive in one important way: once a company becomes part of sensitive defense programs, switching suppliers is often difficult because of security clearances, technical certification, and the need for proven reliability. That does not eliminate risk, but it does make revenue less dependent on short consumer cycles than many industrial companies.
Over the last several years, the business has also become larger and more international. Revenue has risen meaningfully since 2022, although profitability has been less smooth because integration costs, contract execution issues, and accounting charges have affected reported earnings at times. Even so, the company remains primarily a defense services and technology platform rather than a commodity supplier.
The long-term pattern shows a business that expanded revenue materially from 2022 to 2026, while profits were more volatile. The weak result in 2025 appears to have been an interruption rather than a permanent collapse, with 2026 showing a return to positive operating income and net income. That matters because it suggests the core franchise still generates earnings power, but with periodic execution swings.
Key Figures
| Metric | Value | Sector ⓘ |
|---|---|---|
| Date | Oct 03, 2026 | |
| Context | ||
| Sector | Industrials | |
| Industry | Aerospace & Defense | |
| Market Cap ⓘ | $3.28B | |
| Beta ⓘ | 0.34 | |
Value (Cheapness) | ||
| P/E Ratio ⓘ | 24.52 | 22.45 |
| P/B Ratio ⓘ | 6.21 | 1.98 |
| FCF Yield ⓘ | 9.11% | 6.31% |
| Dividend Yield ⓘ | 2.33% | 1.96% |
| EBIT / EV ⓘ | N/A | 4.81% |
| PEG ⓘ | 1.60 | |
Growth (Business expansion) | ||
| Revenue Growth ⓘ | 3.80% | 9.10% |
| RPS Growth (5Y CAGR) ⓘ | 11.64% | 7.75% |
| EPS Growth (5Y CAGR) ⓘ | -18.78% | -13.59% |
| BVPS Growth (5Y CAGR) ⓘ | -13.28% | 6.22% |
| Margin Growth (5Y Trend) ⓘ | 2.25% | 0.72% |
| FCF Growth (5Y CAGR) ⓘ | 13.78% | 10.98% |
| DPS Growth (5Y CAGR) ⓘ | 7.05% | 9.48% |
Quality (Business durability) | ||
| ROIC (Latest) ⓘ | 26.31% | 10.92% |
| ROA (Latest) ⓘ | -4.11% | 5.41% |
| ROIC (5Y Median) ⓘ | 13.85% | 9.21% |
| ROA (5Y Median) ⓘ | 6.03% | 4.94% |
| Net Debt / EBIT (Latest) ⓘ | 0.55 | 2.07 |
| Net Debt / EBIT (5Y Median) ⓘ | 0.75 | 2.28 |
| Net Debt / EBITDA (Latest) ⓘ | 0.31 | 1.43 |
| Net Debt / Assets ⓘ | 9.40% | 19.27% |
| EBITDA / Interest ⓘ | 12.26 | 9.53 |
| Operating Margin (Latest) ⓘ | 7.71% | 10.50% |
| Operating Margin (5Y Median) ⓘ | 10.57% | 10.27% |
| Debt to Equity (Latest) ⓘ | 76.43% | 65.48% |
| Profit Margin (Latest) ⓘ | 5.59% | 6.62% |
| Free Cash Flow (Latest) ⓘ | $299.21M | |
Momentum (Price trend) | ||
| 3Y Return ⓘ | +80.34% | +58.56% |
| 12M Return (excl. last month) ⓘ | +4.56% | +15.63% |
| 6M Return ⓘ | +11.32% | +4.19% |
| Price vs. 200-Day MA ⓘ | +2.83% | +0.93% |
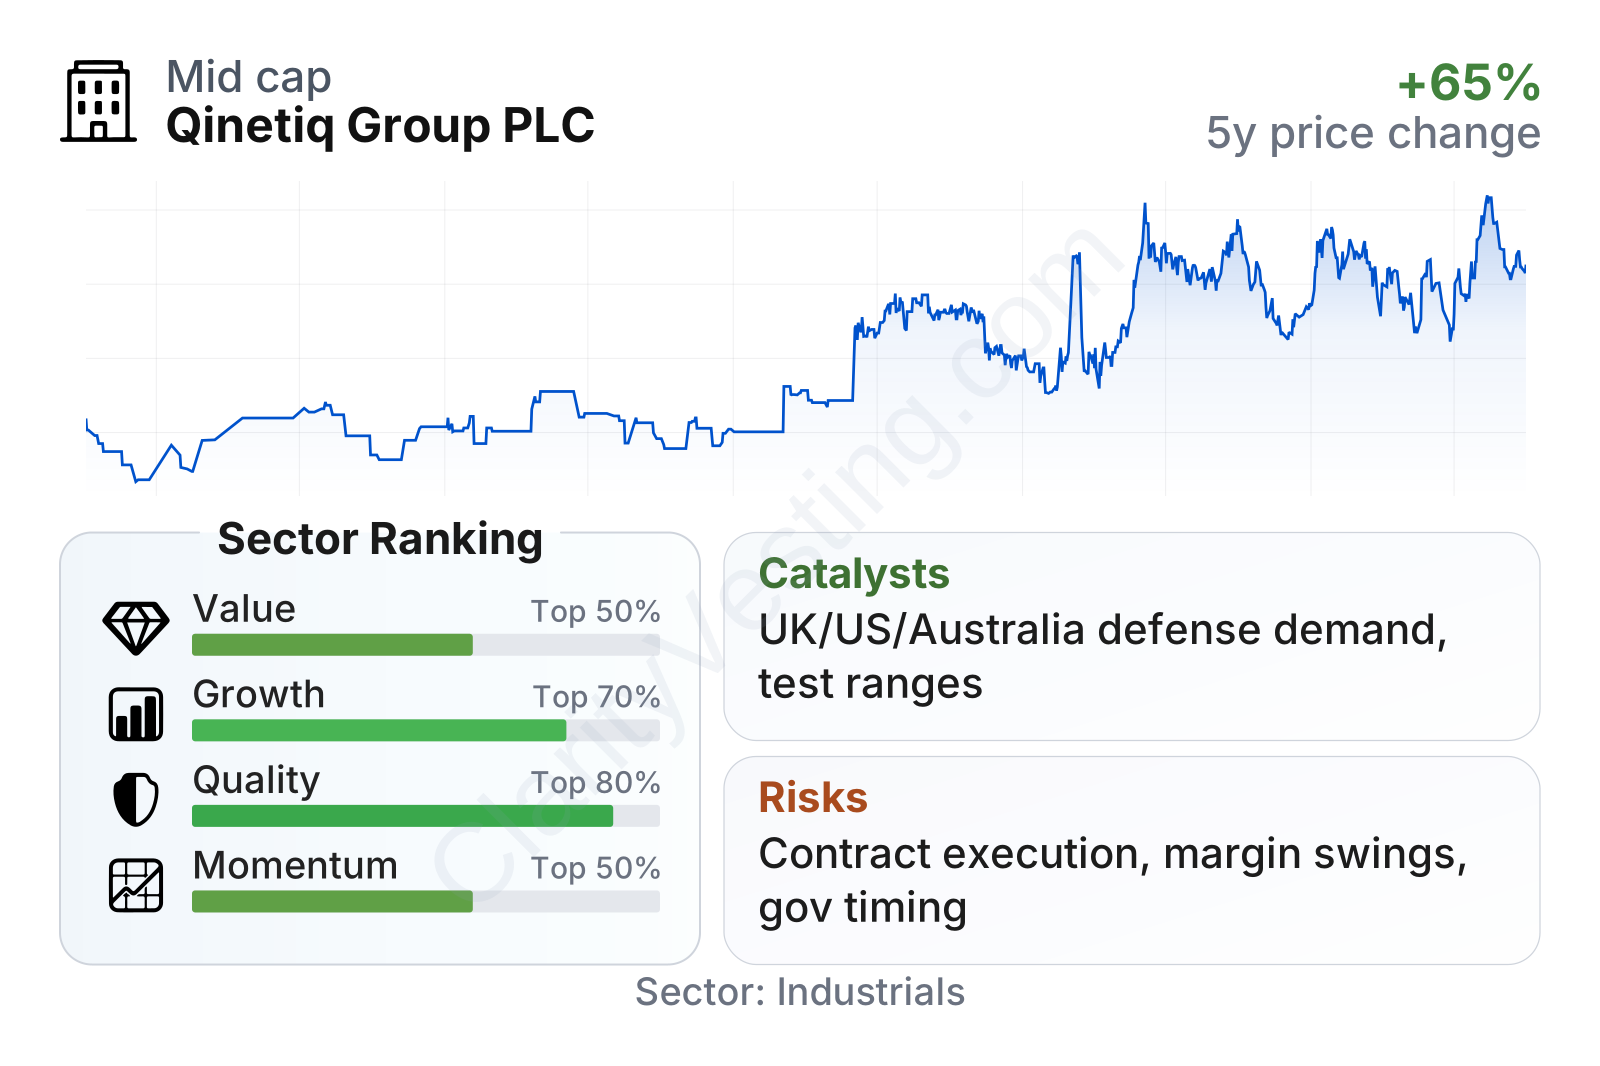
QinetiQ sits in the mid-sized range for listed aerospace and defense companies, and its share price has climbed strongly over the last several years despite periods of volatility. On quality, the picture is generally favorable: returns on invested capital are strong versus the sector, leverage remains manageable on an earnings basis, and interest coverage is solid. Free cash flow is also a notable strength, with cash generation looking better than the sector median.
The weaker spots are recent growth and profitability consistency. Recent year-over-year revenue growth has been modest compared with the sector median, and trailing profit measures have been affected by earlier setbacks. The valuation signals are mixed: earnings multiples are somewhat above the sector median, while cash flow yield and dividend yield are comparatively supportive. In practical terms, the market is not treating QinetiQ as distressed, but it is also not pricing it like a very high-growth defense name.
Growth
QinetiQ operates in a sector with supportive long-term demand. Defense budgets have been rising across many Western countries as governments respond to geopolitical tension, ammunition and readiness needs, drone warfare, naval and missile defense requirements, and the modernization of older military systems. That backdrop matters because QinetiQ is exposed not only to equipment programs, but also to the testing, training, and technical validation that defense spending increasingly requires.
The company’s strategy also makes industrial sense. Instead of competing head-on with the largest prime contractors in platforms such as fighter jets, submarines, or major missile systems, QinetiQ focuses on specialist niches where technical depth, certification, and access to government infrastructure create barriers to entry. Areas such as test and evaluation, autonomous systems, robotics, and mission support are likely to stay relevant as military programs become more software-heavy and more dependent on integration across multiple domains.
Short-term growth, however, has recently been uneven. The latest year-over-year revenue trend shown here is negative, which suggests that timing of contracts, program delays, or portfolio effects can still create temporary pressure. That does not automatically undermine the long-term case, but it does show that QinetiQ is not immune to budget phasing and execution noise.
One meaningful catalyst is the company’s position in defense testing and experimentation. Governments are placing greater emphasis on rapid capability development, especially around autonomous systems, electronic warfare, and survivability. QinetiQ’s established relationships with defense ministries and its access to specialized ranges and facilities could make it a recurring participant in these programs.
Another opportunity comes from international expansion. The group has been building scale beyond the UK, particularly in the U.S. and Australia. If that effort continues successfully, it can reduce dependence on any single defense customer and widen the addressable market. Recent company communications have also emphasized contract wins, pipeline development, and continued demand for mission-led innovation, which points to a business still aligned with government procurement priorities.
Risks
This article is for informational purposes only and does not constitute financial advice. Some content is AI-generated. See Disclaimer


