Stock Analysis · QBE Insurance Group Ltd (QBIEY)
Overview
QBE Insurance Group is a large international property and casualty insurer headquartered in Australia. In simple terms, it sells insurance policies that help individuals and businesses absorb losses from events such as accidents, natural catastrophes, liability claims, crop damage, and operational disruptions. QBE also earns investment income by managing the large pool of premiums it holds before claims are paid, which is a core part of the insurance business model.
QBE organizes its business mainly by geography and specialty lines. Based on its latest company reporting, revenue is driven primarily by insurance underwriting, with investment returns adding an important second layer of earnings. Gross written premium is spread across several operating divisions, led by North America and International, with Australia Pacific also contributing meaningfully.
The main revenue sources can be summarized as follows:
- North America insurance operations: approximately 35% to 40% of group gross written premium. This includes commercial property and casualty insurance, crop insurance, and specialty products.
- International insurance operations: approximately 30% to 35%. This segment includes European operations and global specialty lines such as marine, aviation, financial lines, and other complex commercial risks.
- Australia Pacific insurance operations: approximately 20% to 25%. This covers commercial, personal, and specialty insurance sold in Australia and nearby markets.
- Investment income: a smaller but still significant earnings source, usually contributing less than underwriting revenue but becoming more valuable when bond yields are higher.
- Other fee and service income: a limited contribution relative to the core insurance businesses.
Over the past few years, the business has shown a clear improvement in earnings conversion. Revenue and operating income have expanded meaningfully since 2021, while net income has climbed from a lower base after a weaker 2022. That pattern suggests better underwriting conditions, stronger pricing, and support from investment returns.
Key Figures
| Metric | Value | Sector ⓘ |
|---|---|---|
| Date | Oct 03, 2026 | |
| Context | ||
| Sector | Financial Services | |
| Industry | Insurance - Property & Casualty | |
| Market Cap ⓘ | $24.26B | |
| Beta ⓘ | 0.12 | |
Value (Cheapness) | ||
| P/E Ratio ⓘ | 11.44 | 12.60 |
| P/B Ratio ⓘ | 2.08 | 1.23 |
| FCF Yield ⓘ | 27.12% | 10.16% |
| Dividend Yield ⓘ | 4.90% | 2.96% |
| EBIT / EV ⓘ | N/A | 7.77% |
| PEG ⓘ | N/A | |
Growth (Business expansion) | ||
| Revenue Growth ⓘ | 8.30% | 9.50% |
| RPS Growth (5Y CAGR) ⓘ | 14.03% | 12.10% |
| EPS Growth (5Y CAGR) ⓘ | 12.03% | -9.45% |
| BVPS Growth (5Y CAGR) ⓘ | 6.42% | 5.01% |
| Margin Growth (5Y Trend) ⓘ | 4.50% | -4.07% |
| FCF Growth (5Y CAGR) ⓘ | 12.41% | 4.96% |
| DPS Growth (5Y CAGR) ⓘ | 48.42% | 8.79% |
Quality (Business durability) | ||
| ROIC (Latest) ⓘ | N/A | 9.60% |
| ROE (Latest) ⓘ | N/A | 13.84% |
| ROA (Latest) ⓘ | N/A | 1.53% |
| ROIC (5Y Median) ⓘ | 12.55% | 7.86% |
| ROE (5Y Median) ⓘ | 14.43% | 12.20% |
| ROA (5Y Median) ⓘ | 3.60% | 1.29% |
| Net Debt / EBIT (Latest) ⓘ | N/A | 0.91 |
| Net Debt / EBIT (5Y Median) ⓘ | 0.83 | 0.74 |
| Net Debt / EBITDA (Latest) ⓘ | N/A | 0.97 |
| Operating Margin (Latest) ⓘ | N/A | 22.12% |
| Operating Margin (5Y Median) ⓘ | 9.54% | 24.39% |
| Debt to Equity (Latest) ⓘ | 37.61% | 60.37% |
| Profit Margin (Latest) ⓘ | 11.15% | 26.62% |
| Free Cash Flow (Latest) ⓘ | $6.58B | |
Momentum (Price trend) | ||
| 3Y Return ⓘ | +90.07% | +89.23% |
| 12M Return (excl. last month) ⓘ | +19.49% | +17.35% |
| 6M Return ⓘ | +8.89% | +10.00% |
| Price vs. 200-Day MA ⓘ | +4.42% | +3.73% |
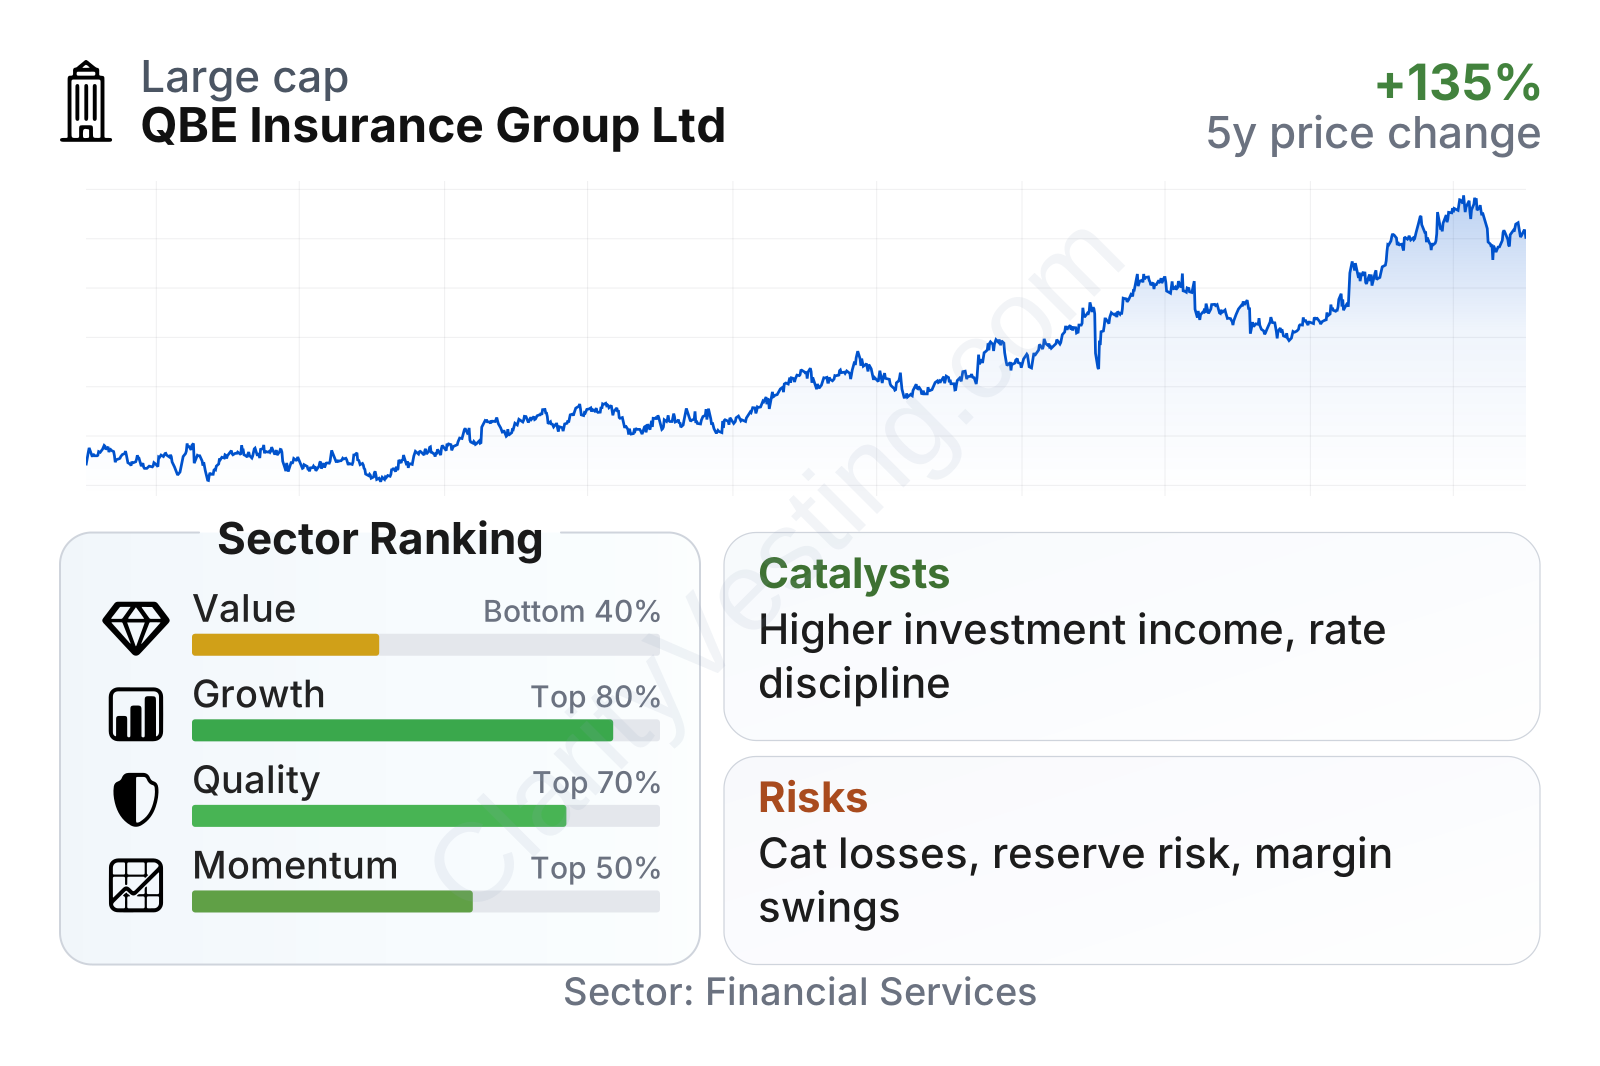
QBE is a large insurer by market value, and its share price has trended upward strongly over the last several years, with periods of volatility along the way. In the summary metrics, growth and quality stand out more positively than value and momentum. The stock trades on an earnings multiple modestly below the sector median, but its price-to-book ratio is well above the sector norm, showing that the market is assigning a premium to its balance sheet and earnings profile. Cash generation and dividend yield also appear stronger than many peers, which supports the company’s financial flexibility.
Growth
The company operates in a sector with durable long-term demand. Property and casualty insurance tends to grow with economic activity, asset values, replacement costs, and rising awareness of risk. In recent years, an additional tailwind has come from repricing across commercial insurance markets, especially in lines exposed to inflation, catastrophe losses, and complex liability risks. That matters for QBE because it has meaningful exposure to commercial and specialty insurance where disciplined pricing can lift profitability.
QBE’s strategy is broadly logical for future growth. Management has emphasized underwriting discipline, selective expansion in specialty lines, and portfolio reshaping rather than chasing volume at any price. For an insurer, this is important: premium growth only creates value when claims and expenses remain under control. The company also benefits from geographic diversification, which reduces dependence on one single market and creates more opportunities to shift capital toward better-returning segments.
Earnings progress has been solid. Over five years, earnings per share growth has been clearly positive and stronger than the sector median, and the latest reported level indicates that profitability has continued to improve into 2025. That supports the view that recent growth is not only coming from premium volume, but also from better margins.
Book value per share has also moved steadily higher over time. For insurers, this matters because book value reflects the company’s net asset base after liabilities, and sustained growth usually signals that retained earnings are building shareholder capital rather than being eroded by poor underwriting or investment losses.
A meaningful catalyst is the interest-rate backdrop. Insurers invest a large portion of their float in fixed-income securities, so higher reinvestment yields can support future investment income even if underwriting conditions become less favorable. Another catalyst is continued insurance rate adequacy in commercial and specialty lines, where QBE can benefit from disciplined pricing. Recent company updates have also pointed to continued premium momentum and a focus on improving returns rather than simply expanding scale.
Risks
This article is for informational purposes only and does not constitute financial advice. Some content is AI-generated. See Disclaimer