Stock Analysis · Qnity Electronics Inc (Q)
Overview
Qnity Electronics Inc operates in semiconductor equipment and materials, a part of the technology sector that supplies the tools, systems, and related services used to manufacture chips. In simple terms, the company sells equipment and know-how that chipmakers need in order to produce semiconductors for areas such as data centers, artificial intelligence, consumer electronics, automotive electronics, and industrial applications.
The business model appears centered on selling equipment with an ongoing service and support layer around the installed base. In this type of industry, revenue usually comes from a mix of new systems, upgrades, spare parts, and service contracts. Publicly available company materials indicate that Qnity’s business is tied to customer investment cycles in chip manufacturing capacity and process technology.
Based on the company’s reported financial structure and its industry profile, the main revenue drivers can be summarized as follows:
- Equipment and system sales: likely the largest source of revenue, driven by purchases from semiconductor manufacturers building or upgrading production lines.
- Service, support, and spares: recurring revenue tied to maintenance, replacement parts, and productivity support for equipment already deployed at customer sites.
- Process-related upgrades and other offerings: smaller contributions from retrofits, software or control improvements, and other specialty items where available.
Revenue has been somewhat cyclical in recent years, moving from about $4.8 billion in 2022 down to roughly $4.0 billion in 2023, then recovering to about $4.3 billion in 2024 and nearly $4.8 billion again in 2025. What stands out is that profitability held up relatively well through that cycle: operating income rebounded strongly in 2024 and improved further in 2025, suggesting tighter cost control and better operating efficiency as demand recovered.
The business mix also shows an encouraging pattern. Even with revenue not far above the 2022 level by 2025, operating income moved higher, which points to stronger execution. Research and development spending remained meaningful, in the low-to-mid hundreds of millions of dollars annually, showing continued investment in future products while preserving healthy operating margins.
Key Figures
| Metric | Value | Sector ⓘ |
|---|---|---|
| Date | Oct 24, 2026 | |
| Context | ||
| Sector | Technology | |
| Industry | Semiconductor Equipment & Materials | |
| Market Cap ⓘ | $24.91B | |
| Beta ⓘ | N/A | |
Value (Cheapness) | ||
| P/E Ratio ⓘ | 42.52 | 29.68 |
| FCF Yield ⓘ | 3.31% | 4.28% |
| Dividend Yield ⓘ | 0.19% | 1.30% |
| EBIT / EV ⓘ | 3.66% | 2.70% |
| PEG ⓘ | 1.32 | |
Growth (Business expansion) | ||
| Revenue Growth ⓘ | 22.10% | 15.80% |
| RPS Growth (5Y CAGR) ⓘ | -0.01% | 8.56% |
| EPS Growth (5Y CAGR) ⓘ | N/A | -11.54% |
| Margin Growth (5Y Trend) ⓘ | 1.58% | 0.46% |
| FCF Growth (5Y CAGR) ⓘ | 1.28% | 9.76% |
| DPS Growth (5Y CAGR) ⓘ | N/A | 7.79% |
Quality (Business durability) | ||
| ROIC (Latest) ⓘ | 6.82% | 9.38% |
| ROIC (5Y Median) ⓘ | N/A | 8.32% |
| Net Debt / EBIT (Latest) ⓘ | 2.87 | 0.52 |
| Net Debt / EBIT (5Y Median) ⓘ | 0.13 | 0.46 |
| Net Debt / EBITDA (Latest) ⓘ | 2.11 | 0.28 |
| Net Debt / Assets ⓘ | 21.35% | 3.44% |
| EBITDA / Interest ⓘ | 7.75 | 13.20 |
| Operating Margin (Latest) ⓘ | 20.44% | 9.70% |
| Operating Margin (5Y Median) ⓘ | 20.37% | 8.51% |
| Debt to Equity (Latest) ⓘ | 55.36% | 33.40% |
| Profit Margin (Latest) ⓘ | 11.25% | 7.14% |
| Free Cash Flow (Latest) ⓘ | $825.00M | |
Momentum (Price trend) | ||
| 3Y Return ⓘ | N/A | +55.43% |
| 12M Return (excl. last month) ⓘ | +32.97% | +10.33% |
| 6M Return ⓘ | -14.19% | +7.97% |
| Price vs. 200-Day MA ⓘ | -7.61% | +5.41% |
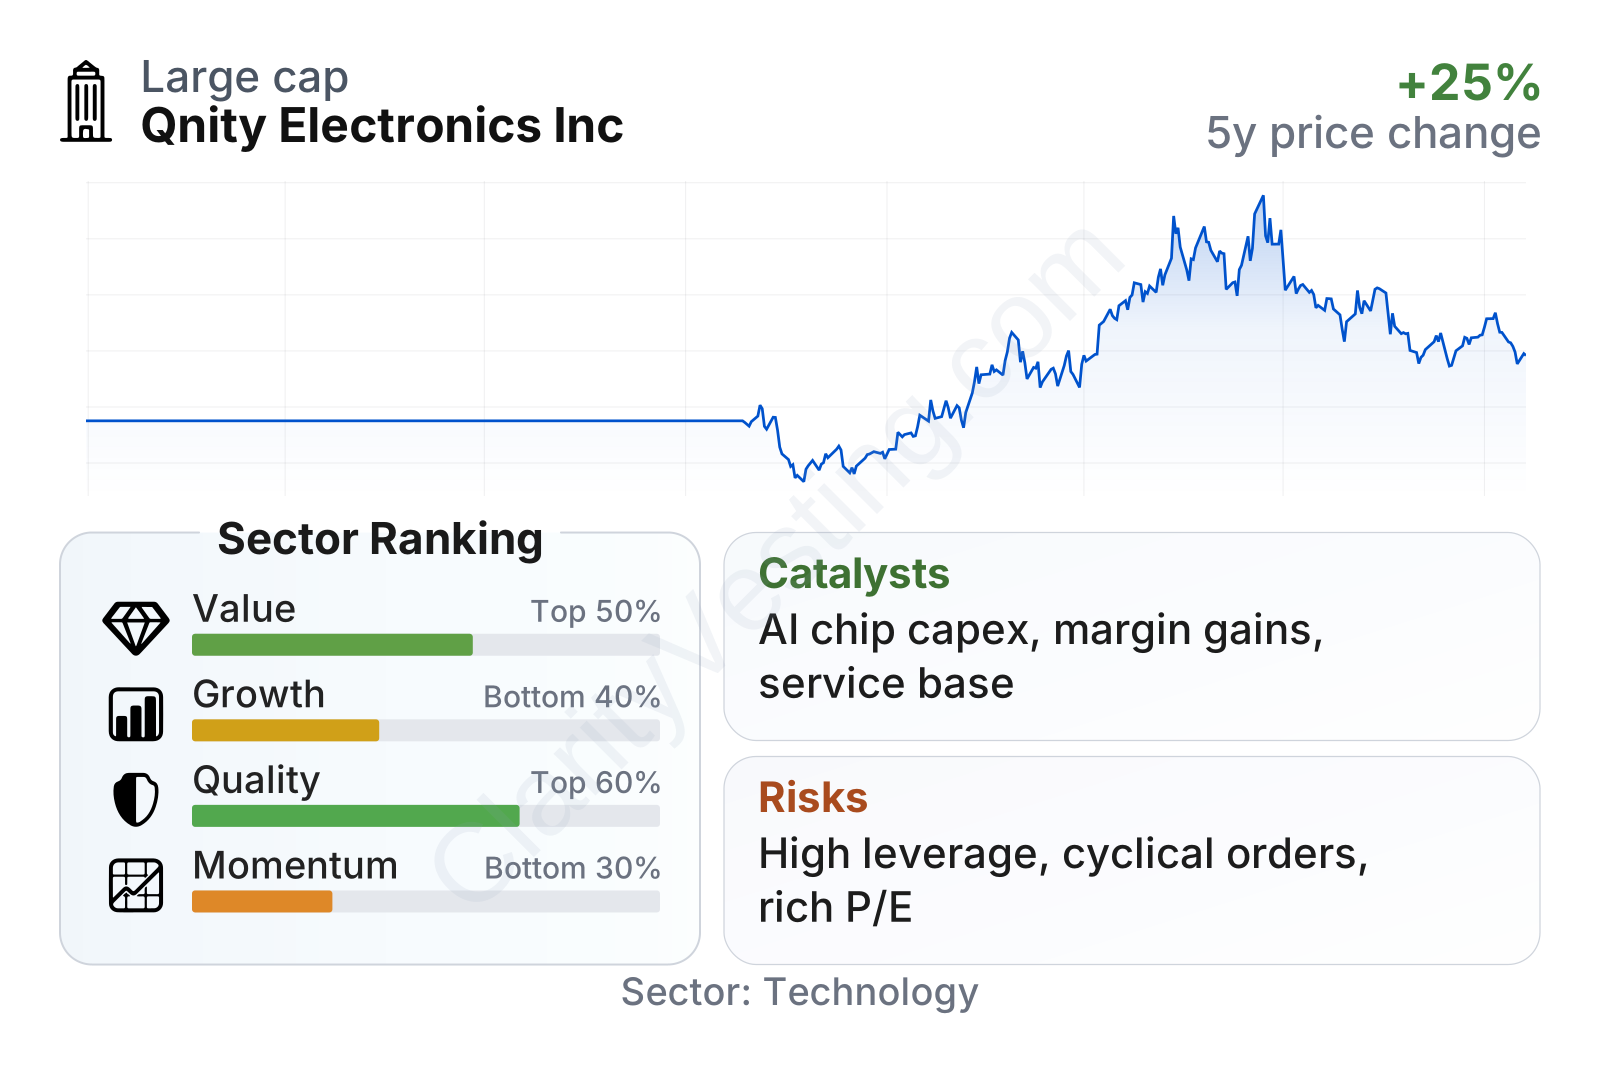
Qnity is a large technology company by market value, but not one of the very biggest names in the semiconductor equipment space. The table suggests a mixed profile. On quality, operating profitability is clearly above the sector median, and profit margin is also stronger than many peers. On growth, the picture is less consistent: recent year-over-year revenue growth is solid, but the longer five-year trend is weaker than the sector median. On valuation, the stock trades at a higher earnings multiple than the sector median, while free cash flow yield is lower, which usually means the market is already pricing in a meaningful amount of future improvement.
Recent share-price behavior also reflects that balance. The stock advanced strongly over the past year before cooling off, and momentum now looks more moderate than many sector peers. That usually means expectations have risen, but the market is waiting for another clear operating or demand catalyst.
Growth
Qnity operates in a sector with favorable long-term demand drivers. Semiconductor equipment benefits from the broader need for more chips, more advanced manufacturing steps, and higher performance computing. Artificial intelligence infrastructure, advanced packaging, memory upgrades, automotive electronics, and industrial automation all support long-run equipment spending, even though orders can fluctuate sharply from year to year.
The company’s strategy appears sensible for that environment. It continues to spend on research and development while maintaining strong operating margins, which is important in semiconductor equipment because customer relationships often depend on precision, reliability, and process performance rather than price alone. The improvement in operating income in 2025, despite gross profit being relatively stable, indicates that management has been extracting better efficiency from the business.
A notable positive signal is the recent revenue rebound. Latest metrics show year-over-year revenue growth of about 22%, ahead of the sector median. That does not erase a softer five-year growth profile, but it does suggest that Qnity is participating in the current upturn. Free cash flow remains positive at more than $800 million on a trailing basis, giving the company flexibility to fund development, service its debt, and support operations through industry swings.
Another potential catalyst is installed-base monetization. In this industry, every piece of equipment sold can create follow-on demand for service, maintenance, upgrades, and consumables. That can make earnings more resilient over time than a pure one-time equipment sale model, especially if chipmakers focus on improving productivity rather than building entirely new fabs.
Risks
This article is for informational purposes only and does not constitute financial advice. Some content is AI-generated. See Disclaimer


