Stock Analysis · Hyperliquid Strategies Inc (PURR)
Overview
Hyperliquid Strategies Inc. is a small capital-markets company whose public profile is currently dominated by its exposure to digital assets rather than by a broad, traditional operating business. Based on recent public filings, the company has been repositioning itself around crypto-related treasury and strategy activities, which helps explain why reported earnings can look unusual compared with revenue from normal operations.
The latest available numbers show a very small revenue base alongside a much larger level of net income, which suggests that recent results were driven mainly by non-operating gains such as investment, fair-value, or other balance-sheet-related items rather than by a large recurring service business. That distinction matters for long-term analysis because it means the headline profit figure does not necessarily describe the earning power of the core business.
Public disclosures do not provide a clear, detailed segment split that allows a reliable percentage breakdown of revenue sources at this stage. What can be said with reasonable confidence is that the company appears to have two economic layers:
- Core operating revenue: a relatively small amount tied to its underlying capital-markets activities.
- Investment and treasury-related gains: the much more important driver of recent bottom-line performance, even though these items may not be recorded as ordinary revenue.
This makes Hyperliquid Strategies less comparable to a standard fee-based financial company and more comparable to a listed vehicle whose results can be heavily influenced by the value of assets it owns or strategies it runs.
The latest income flow reinforces that picture: revenue remains limited, operating income was slightly negative, and net income was exceptionally large by comparison. In plain English, the company recently made far more money below the operating line than through its day-to-day business activities, which raises both the upside and the uncertainty around future results.
Key Figures
| Metric | Value | Sector ⓘ |
|---|---|---|
| Date | Oct 24, 2026 | |
| Context | ||
| Sector | Financial Services | |
| Industry | Capital Markets | |
| Market Cap ⓘ | $2.68B | |
| Beta ⓘ | N/A | |
Value (Cheapness) | ||
| P/E Ratio ⓘ | 3.00 | 12.46 |
| P/B Ratio ⓘ | 0.93 | 1.25 |
| FCF Yield ⓘ | -0.72% | 9.82% |
| Dividend Yield ⓘ | N/A | 2.94% |
| EBIT / EV ⓘ | -0.22% | 8.11% |
| PEG ⓘ | N/A | |
Growth (Business expansion) | ||
| Revenue Growth ⓘ | N/A | 9.10% |
| RPS Growth (5Y CAGR) ⓘ | N/A | 12.31% |
| EPS Growth (5Y CAGR) ⓘ | N/A | -6.97% |
| BVPS Growth (5Y CAGR) ⓘ | N/A | 5.02% |
| Margin Growth (5Y Trend) ⓘ | N/A | -4.00% |
| FCF Growth (5Y CAGR) ⓘ | N/A | 4.71% |
| DPS Growth (5Y CAGR) ⓘ | N/A | 8.92% |
Quality (Business durability) | ||
| ROIC (Latest) ⓘ | -0.55% | 9.18% |
| ROE (Latest) ⓘ | 33.95% | 13.93% |
| ROA (Latest) ⓘ | N/A | 1.57% |
| ROIC (5Y Median) ⓘ | N/A | 7.80% |
| ROE (5Y Median) ⓘ | N/A | 12.15% |
| ROA (5Y Median) ⓘ | N/A | 1.28% |
| Net Debt / EBIT (Latest) ⓘ | N/A | 1.02 |
| Net Debt / EBIT (5Y Median) ⓘ | N/A | 0.72 |
| Net Debt / EBITDA (Latest) ⓘ | N/A | 0.88 |
| Operating Margin (Latest) ⓘ | -60.10% | 22.30% |
| Operating Margin (5Y Median) ⓘ | N/A | 24.50% |
| Debt to Equity (Latest) ⓘ | N/A | 59.34% |
| Profit Margin (Latest) ⓘ | 3229.83% | 26.42% |
| Free Cash Flow (Latest) ⓘ | -$19.15M | |
Momentum (Price trend) | ||
| 3Y Return ⓘ | N/A | +95.73% |
| 12M Return (excl. last month) ⓘ | N/A | +17.30% |
| 6M Return ⓘ | +41.37% | +6.07% |
| Price vs. 200-Day MA ⓘ | +16.35% | +5.36% |
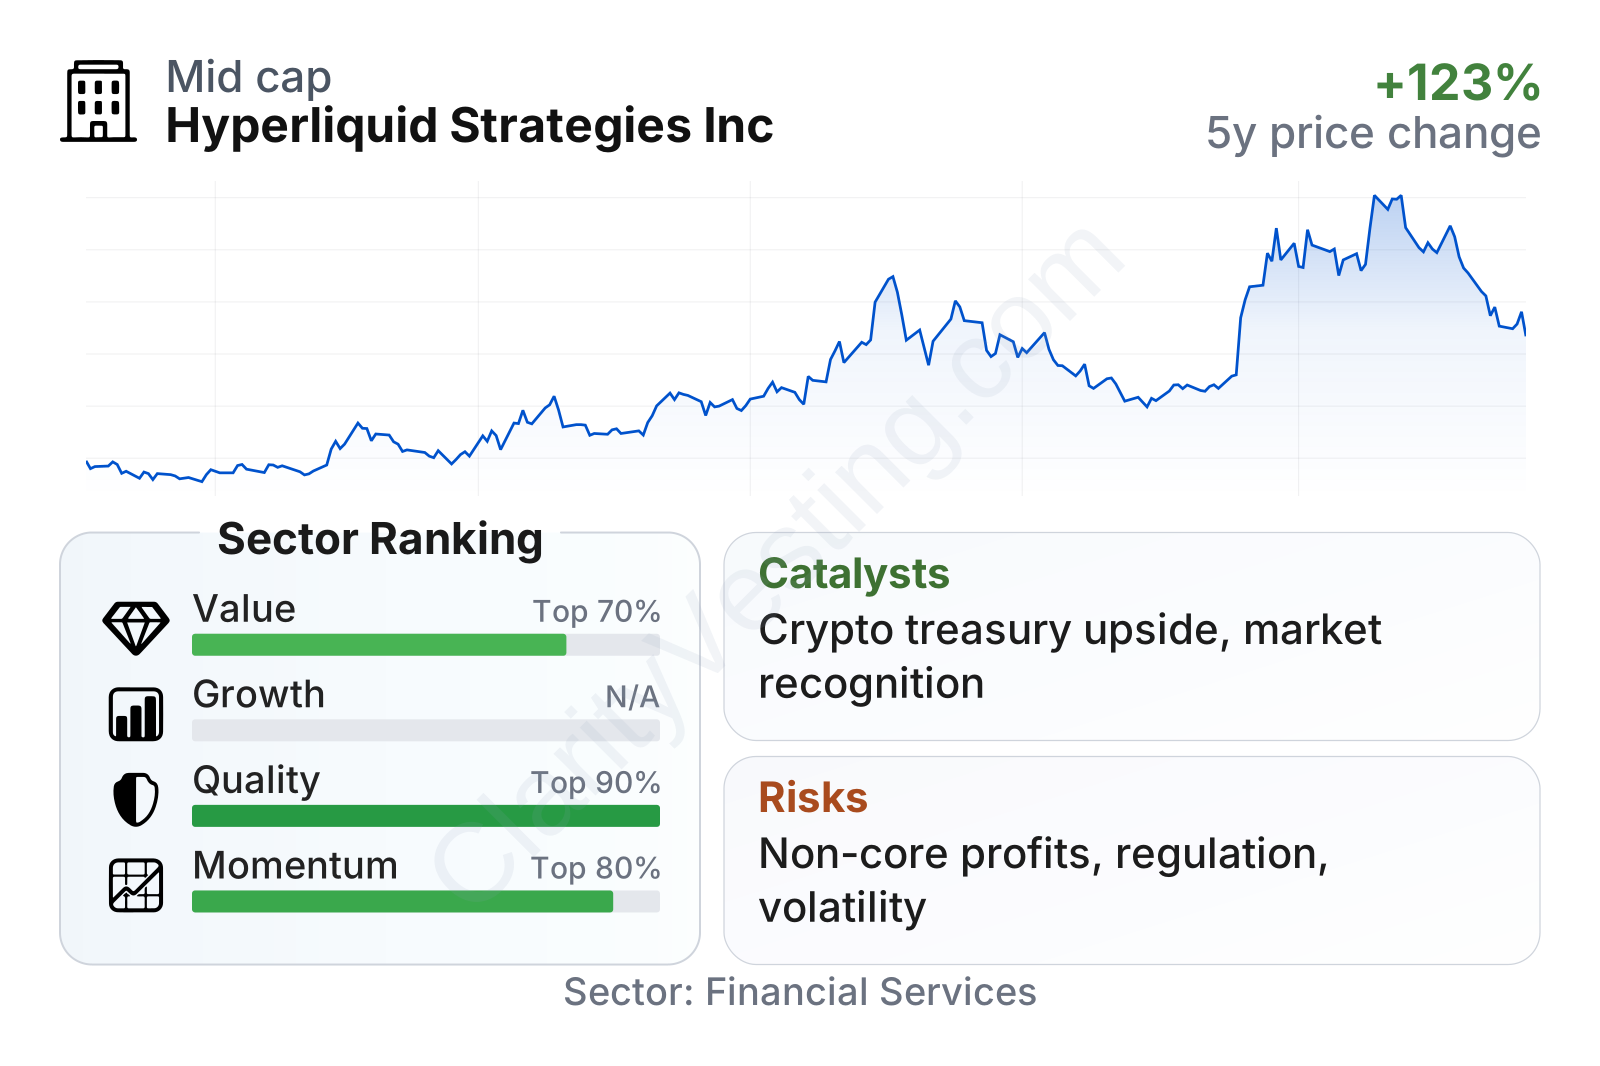
The market is treating Hyperliquid Strategies as a fast-moving, special-situation stock rather than a steady compounding financial business. The share price has climbed sharply over the last several months, far outperforming the typical company in its sector over the same period.
The factor profile is unusual. On one hand, the stock looks inexpensive on earnings, with a P/E far below the sector median. On the other hand, cash generation is currently weak, free cash flow is negative, and operating profitability is well below normal sector levels. Quality metrics are therefore mixed: return on equity is very strong, but that strength does not line up with operating margin or cash flow, which suggests recent profits were influenced by items that may not repeat in the same way.
The company is also still small in public-market terms, which can create both greater upside potential and greater volatility than established financial firms.
Growth
Hyperliquid Strategies sits near several areas that continue to attract capital and attention: digital assets, token-based market infrastructure, and public companies using balance-sheet strategies tied to crypto ecosystems. Those are growing parts of the broader financial landscape, even though they remain cyclical and speculative.
If management can keep building a recognizable identity around crypto-linked capital allocation while maintaining access to public markets, the strategy has a clear growth logic. Publicly listed vehicles that offer specialized exposure to hard-to-access asset classes can attract interest quickly, especially when the underlying ecosystem is gaining momentum.
A major catalyst is simple: if the value of the company’s asset base or strategy-linked holdings rises, reported book value and earnings can move sharply. That can create much faster visible growth than would be possible through a traditional fee business alone. Another catalyst is market recognition. The stock’s recent strong momentum suggests that the market has started to assign greater value to the company’s positioning, not just its current operating scale.
There is also a structural opportunity if the Hyperliquid ecosystem itself continues to expand in trading activity, liquidity, and brand relevance within crypto markets. A public company associated with that theme may benefit from increased investor awareness, easier capital raising, and a stronger strategic position over time. That said, the opportunity depends heavily on execution and on the staying power of the underlying crypto cycle.
Risks
This article is for informational purposes only and does not constitute financial advice. Some content is AI-generated. See Disclaimer


