Stock Analysis · Prudential plc (PUKPF)
Overview
Prudential plc is a life and health insurance group focused mainly on Asia and Africa. The company sells products that help customers save, invest, protect their families, and manage medical costs. Its business model combines long-term insurance policies, health coverage, asset management, and distribution partnerships, especially through banks and agency networks. Prudential today is very different from the older U.K.-centered group many people may remember: after major portfolio changes in recent years, it is now primarily an Asia- and Africa-focused insurer.
Its revenue and earnings are driven less by a simple product sale and more by recurring premiums, investment-related income, fees from managing customer assets, and profit from new insurance business written each year. In insurance, reported revenue can swing because of accounting and market movements, so many analysts also focus on measures such as new business profit, insurance service result, embedded value trends, cash generation, and capital strength.
Based on Prudential’s recent reporting structure, the business is centered on these main economic sources:
- Life and health insurance premiums and related insurance earnings: the largest source, coming from protection, savings, participating policies, and medical products sold across Asian markets and Africa.
- Investment and fee-based income: income linked to policyholder assets, spread income, and fees generated from savings and wealth products.
- Asset management: mainly through Eastspring, which manages money for both Prudential policyholders and external clients.
- Geographic contribution: Asia contributes the vast majority of group business, while Africa remains much smaller but is an expansion market.
By geography, Prudential’s new business generation has been led by markets such as Hong Kong, Mainland China-related flows through Hong Kong, Singapore, Malaysia, Indonesia, and other Southeast Asian operations. In broad terms, Asia accounts for well over 90% of group activity, with Africa representing a low-single-share portion of total business. Within Asia, customer demand is strongest in health, protection, savings, and retirement-oriented products.
The business mix also shows a clear shift toward capital-light and health-oriented products, supported by digital tools, agency recruitment, and bancassurance partnerships. That matters because these products can improve cash generation and profitability without requiring the same balance-sheet intensity as some traditional savings products.
The profit path has been uneven on a reported basis, which is common in insurance, but the recent direction is stronger: after a difficult 2022, operating income and net income recovered in 2023 and improved again in 2024 and 2025. That pattern suggests the core franchise has been more resilient than the headline revenue swings alone would imply.
Key Figures
| Metric | Value | Sector ⓘ |
|---|---|---|
| Date | Oct 17, 2026 | |
| Context | ||
| Sector | Financial Services | |
| Industry | Insurance - Life | |
| Market Cap ⓘ | $29.90B | |
| Beta ⓘ | 0.91 | |
Value (Cheapness) | ||
| P/E Ratio ⓘ | 8.57 | 12.26 |
| P/B Ratio ⓘ | 2.15 | 1.23 |
| FCF Yield ⓘ | 11.22% | 10.40% |
| Dividend Yield ⓘ | 2.28% | 3.02% |
| EBIT / EV ⓘ | N/A | 8.14% |
| PEG ⓘ | 2.54 | |
Growth (Business expansion) | ||
| Revenue Growth ⓘ | -1.80% | 9.35% |
| RPS Growth (5Y CAGR) ⓘ | -20.24% | 12.19% |
| EPS Growth (5Y CAGR) ⓘ | -41.90% | -9.53% |
| BVPS Growth (5Y CAGR) ⓘ | -21.65% | 4.99% |
| Margin Growth (5Y Trend) ⓘ | 26.44% | -3.86% |
| FCF Growth (5Y CAGR) ⓘ | 73.94% | 4.81% |
| DPS Growth (5Y CAGR) ⓘ | -14.10% | 8.79% |
Quality (Business durability) | ||
| ROIC (Latest) ⓘ | N/A | 9.49% |
| ROE (Latest) ⓘ | 43.59% | 13.90% |
| ROA (Latest) ⓘ | 3.79% | 1.55% |
| ROIC (5Y Median) ⓘ | 9.36% | 7.86% |
| ROE (5Y Median) ⓘ | 9.94% | 12.17% |
| ROA (5Y Median) ⓘ | 1.02% | 1.30% |
| Net Debt / EBIT (Latest) ⓘ | N/A | 0.96 |
| Net Debt / EBIT (5Y Median) ⓘ | 0.73 | 0.73 |
| Net Debt / EBITDA (Latest) ⓘ | -0.02 | 0.92 |
| Operating Margin (Latest) ⓘ | N/A | 22.30% |
| Operating Margin (5Y Median) ⓘ | 18.06% | 24.63% |
| Debt to Equity (Latest) ⓘ | 27.47% | 58.56% |
| Profit Margin (Latest) ⓘ | 25.49% | 26.57% |
| Free Cash Flow (Latest) ⓘ | $3.36B | |
Momentum (Price trend) | ||
| 3Y Return ⓘ | +18.85% | +88.33% |
| 12M Return (excl. last month) ⓘ | +8.01% | +19.38% |
| 6M Return ⓘ | -21.22% | +4.75% |
| Price vs. 200-Day MA ⓘ | +19.62% | +3.50% |
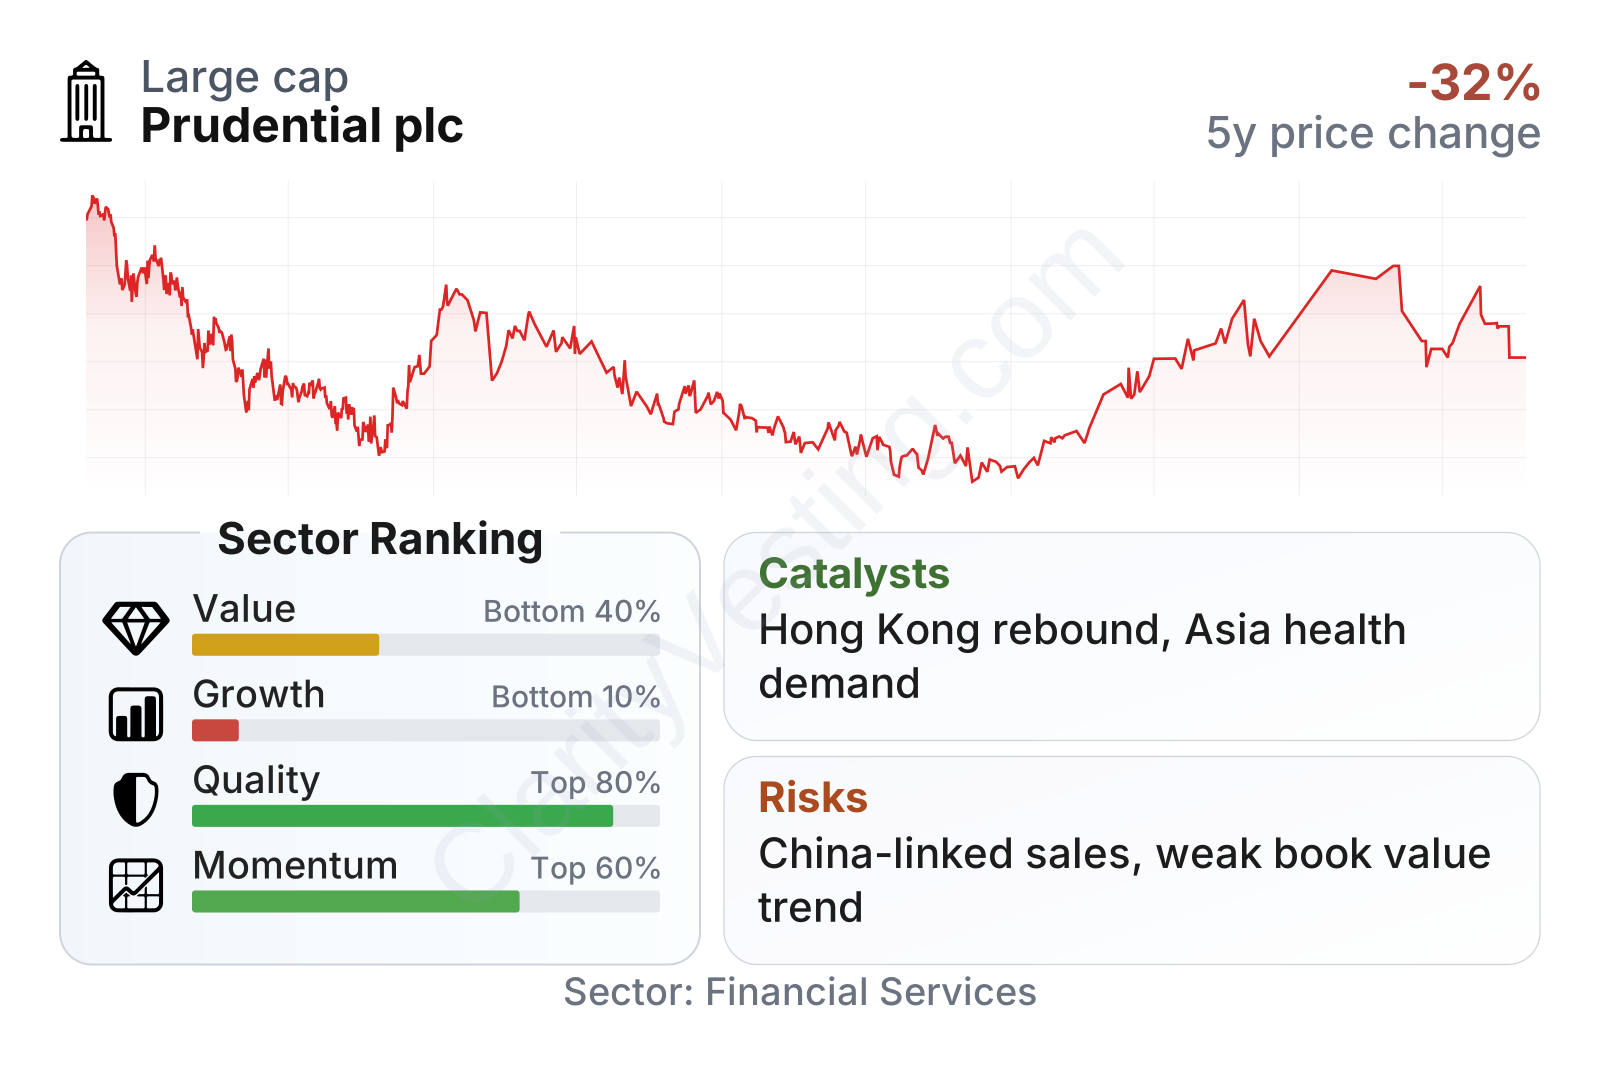
Prudential is a large insurer with a market value around $30 billion and a share-price volatility slightly below the broader market. The table points to a mixed profile. On valuation, the earnings multiple is below the sector median, but the price-to-book ratio is above it, which shows the market is assigning a premium to parts of the franchise despite weak longer-term book value trends. On quality, profitability ratios are strong versus peers, leverage looks manageable, and free cash flow is solid. On growth, however, the picture is weak: revenue, earnings per share, book value per share, and dividends have all had difficult multi-year trends relative to the sector. Price momentum sits in the middle of the pack, with a recent recovery from prior lows but still lagging many financial peers over longer periods.
The share-price history also reflects this mixed record. The stock fell sharply from 2021 into 2024, then recovered into 2026. That rebound suggests sentiment has improved, but it also shows that the market has needed proof that Prudential can translate its Asian growth footprint into more consistent shareholder outcomes.
Growth
Prudential operates in one of the more attractive areas of global insurance: Asian and African life, health, and savings markets where insurance penetration is still relatively low and middle-class wealth is rising over time. In simple terms, many households in these regions are becoming more able to afford insurance and long-term savings products, while aging populations and stretched public health systems are increasing demand for private protection.
That sector backdrop supports Prudential’s strategy. The company is focusing on markets where it already has scale, strong brands, and local distribution. It is also leaning into products tied to medical needs, protection, and long-term savings rather than relying only on lower-margin volume. Bancassurance agreements, tied-agent recruitment, and digital customer tools are central to that model because insurance often depends on trust, local access, and repeat customer contact.
One important catalyst is Hong Kong’s role as a hub for cross-border customer flows, especially from Mainland China. When travel and economic activity normalize, Prudential can benefit from demand for savings and protection products purchased through Hong Kong. Another catalyst is Eastspring, the asset-management arm, which gives the group an additional fee stream and a broader relationship with customers beyond pure insurance.
Recent company reporting has also highlighted continued progress in new business generation and operating profit in key Asian markets. That matters because insurers create much of their value when they write profitable new policies that can generate earnings and cash over many years. If Prudential keeps improving product mix and distribution efficiency, growth can come not only from selling more policies but from selling better ones.
The weak book value per share trend over the last several years is a clear limitation, and it should not be ignored. Even so, for insurers like Prudential, book value alone does not capture the full worth of future profits embedded in long-duration policies. The more encouraging point is that operating profitability has been recovering even while accounting-based balance-sheet measures have looked pressured.
A further support for growth is the company’s capital-light discipline. Prudential has emphasized cash remittances from local businesses, tighter capital allocation, and products with better return characteristics. In a sector where growth can sometimes consume capital, that approach is strategically sensible.
Risks
This article is for informational purposes only and does not constitute financial advice. Some content is AI-generated. See Disclaimer


