Stock Analysis · Prudential PLC (PUK)
Overview
Prudential plc is a life and health insurance group focused on Asia and Africa. After separating its U.S. and U.K./Europe businesses in prior years, the company is now much more concentrated on markets where insurance coverage, retirement savings, and private wealth products still have long run room to expand. Its business model is relatively simple at a high level: it collects premiums, manages policyholder money, earns fees from savings and investment products, and aims to profit from underwriting, asset management, and disciplined use of capital.
The company operates through two main engines. The largest is life and health insurance, which includes protection products, savings plans, and retirement-oriented offerings sold through agency forces, bank partnerships, and digital channels. The second is asset management, led by Eastspring, which manages funds for both Prudential’s insurance operations and third-party clients. Geography matters more than product labels here: Hong Kong, mainland China-related flows, Singapore, Malaysia, Indonesia, and other Southeast Asian markets are central to results, while Africa is smaller but strategically important for future expansion.
Using Prudential’s recent annual reporting structure, its main sources of earnings and business activity can be summarized as follows:
- Insurance and health products in Asia: approximately 80% to 90% of group operating earnings, driven by participating and non-participating life insurance, medical coverage, protection products, and savings-linked policies.
- Hong Kong: the single most important market, representing a large share of new business profit and benefiting from local demand plus cross-border customer flows from mainland China.
- Southeast Asia: a broad contribution across Singapore, Indonesia, Malaysia, and other markets, combining agency sales, bancassurance, and growing health and savings demand.
- Eastspring asset management: approximately 10% to 15% of group operating earnings, generated from management fees on mutual funds, institutional mandates, and insurance-related assets under management.
- Africa: currently a smaller contributor, likely in the low-single-digit to high-single-digit percentage range depending on the measure used, but meaningful as a longer-term growth platform.
One notable pattern in recent years is that reported revenue and profit can swing sharply because insurers are affected by investment markets, accounting treatment, and one-off items. Even so, the broader picture shows a recovery from the weaker 2022 period, with profitability improving meaningfully in 2023 through 2025.
The operating picture has been uneven from year to year, but the recent direction is more favorable: profits rebounded after 2022, operating costs became better aligned with revenue, and net income recovered strongly by 2024 and 2025. That is useful context for a business where headline revenue alone can be misleading.
Key Figures
| Metric | Value | Sector ⓘ |
|---|---|---|
| Date | Oct 03, 2026 | |
| Context | ||
| Sector | Financial Services | |
| Industry | Insurance - Life | |
| Market Cap ⓘ | $30.50B | |
| Beta ⓘ | 0.89 | |
Value (Cheapness) | ||
| P/E Ratio ⓘ | 8.71 | 12.60 |
| P/B Ratio ⓘ | 1.64 | 1.23 |
| FCF Yield ⓘ | 10.89% | 10.16% |
| Dividend Yield ⓘ | 1.10% | 2.96% |
| EBIT / EV ⓘ | N/A | 7.77% |
| PEG ⓘ | 2.43 | |
Growth (Business expansion) | ||
| Revenue Growth ⓘ | -1.80% | 9.50% |
| RPS Growth (5Y CAGR) ⓘ | -14.52% | 12.10% |
| EPS Growth (5Y CAGR) ⓘ | -30.45% | -9.45% |
| BVPS Growth (5Y CAGR) ⓘ | -13.37% | 5.01% |
| Margin Growth (5Y Trend) ⓘ | 26.83% | -4.07% |
| FCF Growth (5Y CAGR) ⓘ | 73.09% | 4.96% |
| DPS Growth (5Y CAGR) ⓘ | -7.91% | 8.79% |
Quality (Business durability) | ||
| ROIC (Latest) ⓘ | N/A | 9.60% |
| ROE (Latest) ⓘ | 40.22% | 13.84% |
| ROA (Latest) ⓘ | 3.75% | 1.53% |
| ROIC (5Y Median) ⓘ | 9.36% | 7.86% |
| ROE (5Y Median) ⓘ | 9.94% | 12.20% |
| ROA (5Y Median) ⓘ | 1.02% | 1.29% |
| Net Debt / EBIT (Latest) ⓘ | N/A | 0.91 |
| Net Debt / EBIT (5Y Median) ⓘ | 0.73 | 0.74 |
| Net Debt / EBITDA (Latest) ⓘ | -0.02 | 0.97 |
| Operating Margin (Latest) ⓘ | N/A | 22.12% |
| Operating Margin (5Y Median) ⓘ | 18.44% | 24.39% |
| Debt to Equity (Latest) ⓘ | 27.44% | 60.37% |
| Profit Margin (Latest) ⓘ | 25.49% | 26.62% |
| Free Cash Flow (Latest) ⓘ | $3.32B | |
Momentum (Price trend) | ||
| 3Y Return ⓘ | +25.30% | +89.23% |
| 12M Return (excl. last month) ⓘ | +3.76% | +17.35% |
| 6M Return ⓘ | -15.04% | +10.00% |
| Price vs. 200-Day MA ⓘ | -14.73% | +3.73% |
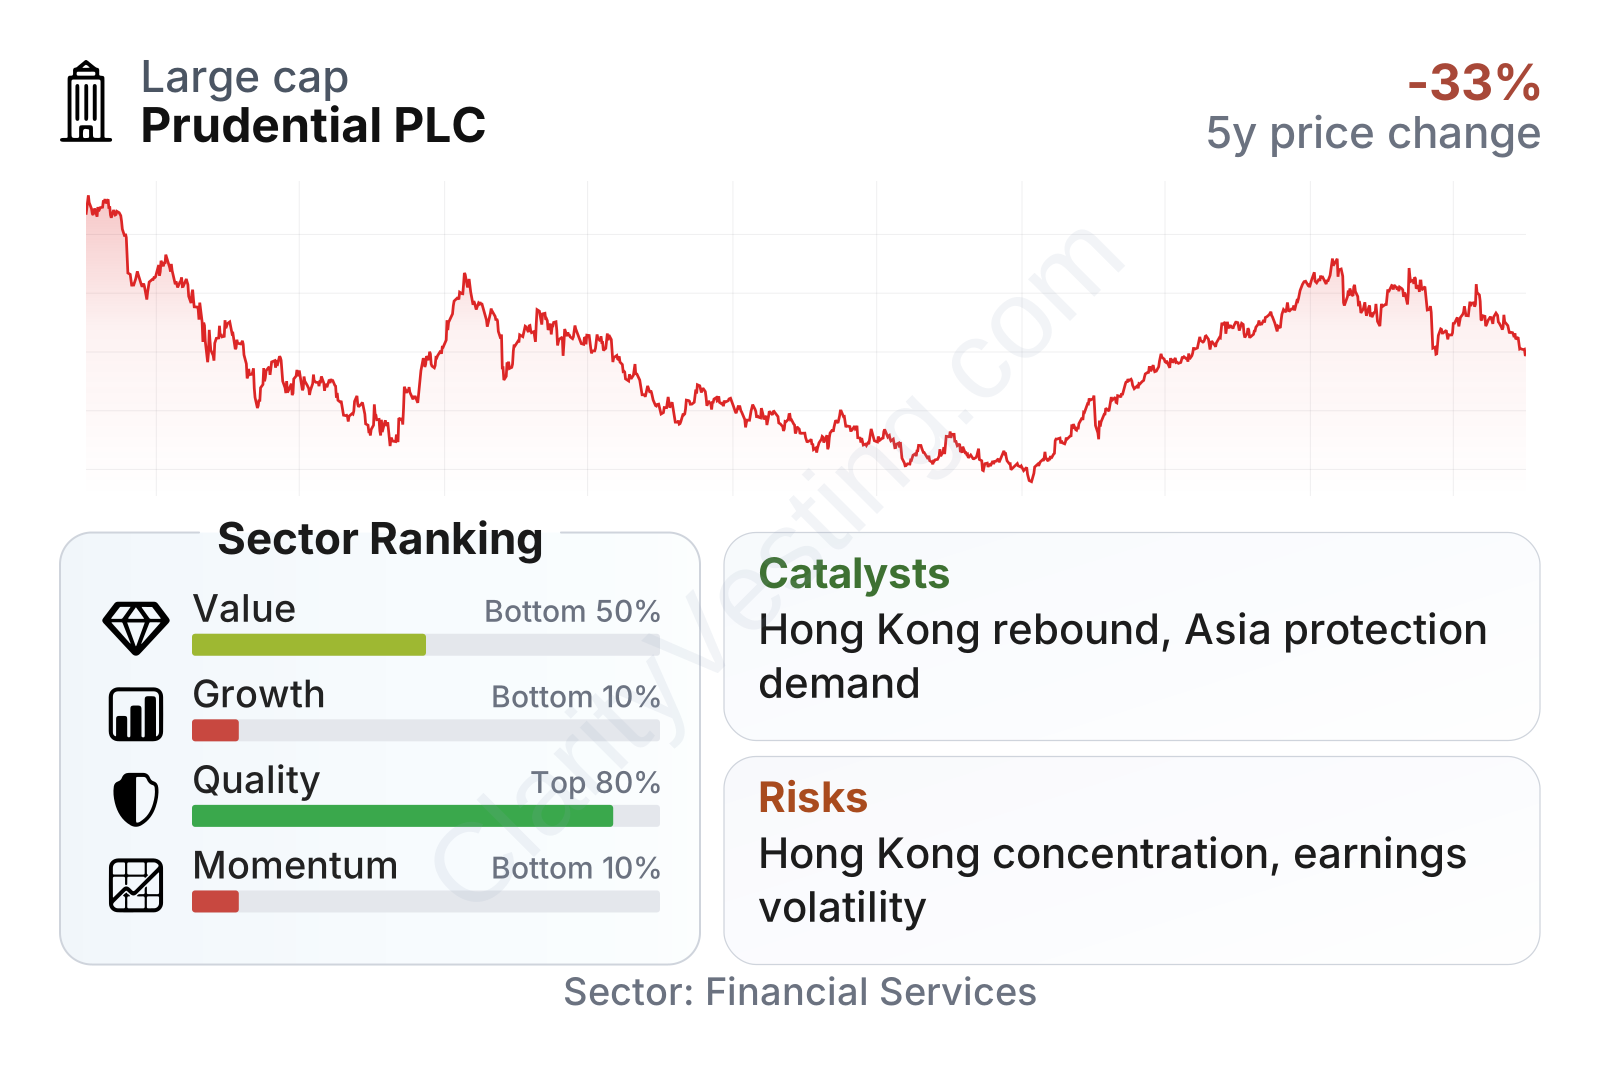
Prudential stands out more for business quality than for recent growth or market momentum. Profitability measures are strong versus much of the insurance sector, with return on equity and return on assets notably above median levels, while leverage looks moderate with debt-to-equity around 27%. At the same time, growth metrics remain weak on a multi-year view, and recent share-price performance has lagged the broader financial sector despite a rebound from earlier lows.
The share price history also shows why the stock can look controversial. It fell heavily from 2021 into 2022, spent much of 2023 and 2024 at subdued levels, then recovered strongly into early 2026 before easing again. That pattern suggests the market has been reassessing both the earnings power of the Asian business and the reliability of its growth path.
Growth
Prudential operates in a sector with genuine structural support. In many Asian and African markets, insurance penetration remains below levels seen in developed economies, while rising incomes, aging populations, and pressure on public healthcare systems are increasing demand for protection and long-term savings products. That backdrop is attractive for insurers that already have local distribution, recognized brands, and enough capital to keep investing through cycles.
Prudential’s strategy broadly fits that opportunity set. The company has chosen to concentrate on higher-growth regions rather than maintain a more diversified but slower-moving footprint. Its agency force, bank partnerships, and digital distribution all matter here: life insurance is not just about product demand, but also about how efficiently a company can reach customers and keep them over many years. Eastspring adds another layer because wealth creation in Asia can support both insurance sales and third-party asset management fees.
A major catalyst has been the normalization of activity in Hong Kong and the return of cross-border demand linked to mainland Chinese customers. That matters because Hong Kong has historically been one of Prudential’s most profitable markets for new business. If travel flows, wealth demand, and high-end protection sales remain healthy, Prudential has a meaningful tailwind without needing dramatic changes in strategy.
Another positive point is cash generation. While reported revenue growth has been soft, free cash flow has improved sharply over the past five years, which suggests the company has been converting business activity into usable capital more effectively. For insurers, this is important because management flexibility depends not only on accounting earnings, but also on remittances, solvency, and deployable cash.
Earnings per share have been volatile rather than smooth. The weak 2022 period was followed by a recovery, but not yet by a consistently rising line. That is one reason the market has remained cautious even as operating performance has improved.
Book value per share has also been unstable, including a marked drop in 2024 before a partial recovery. For an insurer, this matters because book value is closely watched as a rough anchor for financial strength and valuation. A business can still be attractive with uneven book value, but the fluctuations make it harder to argue for a simple, uninterrupted compounding profile.
Recent company updates have also pointed to continued emphasis on health, agency productivity, customer retention, and capital-efficient growth in core Asian markets. None of these are overnight transformations, but together they support a sensible long-term expansion plan if execution remains disciplined.
Risks
This article is for informational purposes only and does not constitute financial advice. Some content is AI-generated. See Disclaimer


