Stock Analysis · Patterson-UTI Energy Inc (PTEN)
Overview
Patterson-UTI Energy is a U.S. oilfield services company. In simple terms, it helps oil and natural gas producers drill wells, complete them, and support production activity in the field. The company became broader after combining with NexTier, adding a much larger well completion business to its traditional drilling franchise. That matters because it moved Patterson-UTI from being mostly a drilling contractor into a more diversified service provider across the life of a shale well.
Its business is tied mainly to North American onshore oil and gas activity, especially U.S. shale basins. Customers are exploration and production companies that hire Patterson-UTI’s rigs, pressure pumping fleets, and related service teams when they want to drill and complete wells.
The company’s revenue comes primarily from three operating areas. Based on recent annual reporting, the mix is led by completion services, then drilling services, with a smaller contribution from drilling products and other services.
- Completion Services: about 60% to 70% of revenue. This includes hydraulic fracturing, wireline, pumping, cementing, and other services used to prepare a well for production. This is now the company’s largest segment.
- Drilling Services: about 25% to 35% of revenue. This is the traditional land rig business, where Patterson-UTI provides drilling rigs, crews, and related equipment for onshore wells.
- Drilling Products and Other: about 5% to 10% of revenue. This includes drill bits, downhole tools, rental tools, directional drilling technologies, and related support offerings.
The overall picture is of a mid-sized energy service company that has expanded its scope, but still depends heavily on customer spending in cyclical U.S. shale markets. Over the last several years, revenue climbed sharply as the market recovered and as the NexTier combination increased scale, but profitability became much weaker again more recently.
The operating profile shows a business that grew strongly from 2021 through 2024, but with costs rising enough to pressure margins. Revenue expanded substantially over that stretch, yet earnings did not keep pace, highlighting how sensitive results are to pricing, utilization, and cost inflation in oilfield services.
Key Figures
| Metric | Value | Sector ⓘ |
|---|---|---|
| Date | Oct 17, 2026 | |
| Context | ||
| Sector | Energy | |
| Industry | Oil & Gas Drilling | |
| Market Cap ⓘ | $4.40B | |
| Beta ⓘ | 0.78 | |
Value (Cheapness) | ||
| P/E Ratio ⓘ | N/A | 15.44 |
| P/B Ratio ⓘ | 1.42 | 1.73 |
| FCF Yield ⓘ | 4.04% | 8.20% |
| Dividend Yield ⓘ | 3.13% | 3.59% |
| EBIT / EV ⓘ | -0.77% | 7.46% |
| PEG ⓘ | 0.78 | |
Growth (Business expansion) | ||
| Revenue Growth ⓘ | 0.70% | 26.90% |
| RPS Growth (5Y CAGR) ⓘ | 15.97% | 6.90% |
| EPS Growth (5Y CAGR) ⓘ | N/A | -15.73% |
| BVPS Growth (5Y CAGR) ⓘ | 0.37% | 6.07% |
| Margin Growth (5Y Trend) ⓘ | N/A | 0.58% |
| FCF Growth (5Y CAGR) ⓘ | N/A | 1.86% |
| DPS Growth (5Y CAGR) ⓘ | 41.34% | 16.79% |
Quality (Business durability) | ||
| ROIC (Latest) ⓘ | -0.73% | 11.40% |
| ROA (Latest) ⓘ | -1.65% | 6.06% |
| ROIC (5Y Median) ⓘ | -0.55% | 10.30% |
| ROA (5Y Median) ⓘ | -1.64% | 5.42% |
| Net Debt / EBIT (Latest) ⓘ | N/A | 1.64 |
| Net Debt / EBIT (5Y Median) ⓘ | N/A | 1.83 |
| Net Debt / EBITDA (Latest) ⓘ | 1.27 | 1.08 |
| Net Debt / Assets ⓘ | 19.70% | 17.29% |
| EBITDA / Interest ⓘ | 11.44 | 9.64 |
| Operating Margin (Latest) ⓘ | -0.88% | 16.27% |
| Operating Margin (5Y Median) ⓘ | -0.67% | 20.39% |
| Debt to Equity (Latest) ⓘ | 40.70% | 54.76% |
| Profit Margin (Latest) ⓘ | -1.92% | 8.82% |
| Free Cash Flow (Latest) ⓘ | $177.72M | |
Momentum (Price trend) | ||
| 3Y Return ⓘ | -5.52% | +67.38% |
| 12M Return (excl. last month) ⓘ | +133.94% | +49.19% |
| 6M Return ⓘ | +18.79% | +7.07% |
| Price vs. 200-Day MA ⓘ | +14.12% | +9.56% |
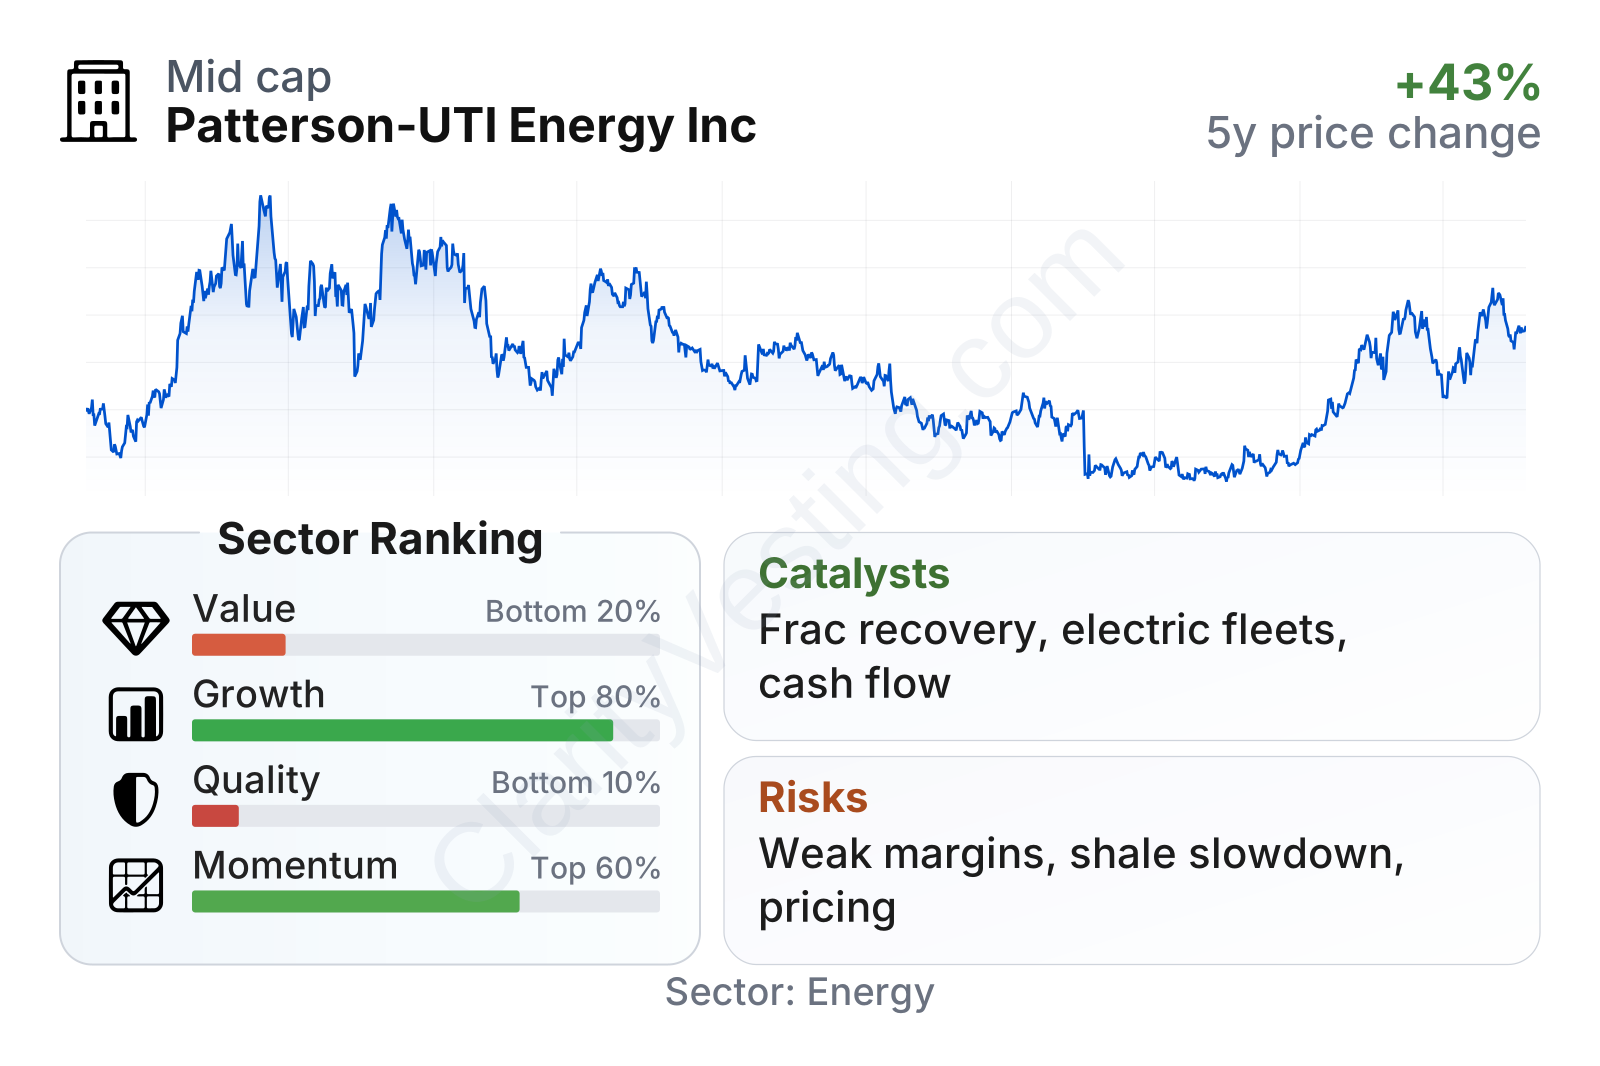
Patterson-UTI’s current snapshot is mixed. Growth-related indicators look better than many peers over a multi-year period, helped by expansion after industry consolidation, while quality measures remain weak because returns on capital, operating margin, and net profitability are still below sector norms. Balance sheet leverage is not unusually high for the industry, and interest coverage remains solid, but valuation metrics do not stand out as especially attractive relative to the company’s current earnings profile. Share price behavior has also been volatile, which is typical for an oilfield services business.
Growth
Patterson-UTI operates in a sector that can grow over time, but not in a smooth line. Oilfield services benefit when producers keep investing in new wells, especially in efficient shale basins where drilling cycles are short and service demand can respond quickly to commodity prices. In that sense, the company has exposure to a market that remains strategically important for U.S. energy supply, but one that is highly cyclical rather than steadily expanding.
The company’s strategy is logical for future growth. Management has been building a broader platform across drilling, completions, and drilling technologies. That creates more ways to serve the same customer and reduces reliance on any one activity. It also gives Patterson-UTI an opportunity to capture more revenue per well, especially when operators prefer integrated service partners. The addition of completion services through the NexTier combination is the biggest example of that approach.
Recent growth trends, however, show that the easy rebound phase has passed. Revenue growth was exceptionally strong in 2022, 2023, and much of 2024, then turned negative, and has only recently moved back to roughly flat territory year over year. That suggests the company is no longer benefiting from the same post-downturn surge and is now working through a softer service market.
One encouraging point is cash generation. Free cash flow improved meaningfully from negative territory in 2022 to clearly positive levels afterward, even if it has moderated from the peak. For a cyclical business, that is important because cash flow can support debt service, equipment investment, and shareholder returns during weaker periods.
As for catalysts, the main ones are operational rather than speculative. A recovery in North American completion activity, better pricing for pressure pumping and drilling rigs, and higher adoption of the company’s technology-enabled drilling and completion tools would all help results. Management has also emphasized capital discipline, fleet modernization, and efficiency improvements, which could matter if the market remains only moderately active rather than booming.
Recent company communications have also highlighted electric frac fleets, automation, and digital drilling technologies as areas of opportunity. These offerings can help customers reduce fuel use, improve efficiency, and lower well-site emissions. In an industry where producers are trying to cut costs and improve environmental performance at the same time, that can be a meaningful commercial advantage if adoption continues to expand.
Risks
This article is for informational purposes only and does not constitute financial advice. Some content is AI-generated. See Disclaimer


