Stock Analysis · PTC Therapeutics Inc (PTCT)
Overview
PTC Therapeutics is a biotechnology company focused on rare diseases. Its business combines commercialized medicines, royalty streams, and drug development programs. The company is best known for treatments in genetic disorders such as Duchenne muscular dystrophy and phenylketonuria, and it also has a broader pipeline in neurology and other rare disease areas. For a long-term reader, the key point is that PTC is no longer only a research-stage biotech: it already has marketed products and partnership economics, but its future still depends heavily on execution in development and commercialization.
Revenue has become more diversified than in many small and mid-sized biotech companies, although it is still concentrated in a limited number of assets. Based on the latest annual results and company disclosures, the main sources of revenue can be summarized as follows:
- Collaboration and license revenue: approximately 45% to 55% of recent annual revenue. This can include milestone payments, upfront or development-related payments, and other partner economics. This line can be large but is often less predictable than recurring product sales.
- Product sales of Translarna: approximately 25% to 35%. This medicine has historically been a major commercial asset, especially outside the United States, for nonsense mutation Duchenne muscular dystrophy.
- Product sales of Evrysdi-related economics and other commercial products such as Emflaza and Upstaza: together approximately 15% to 25%, depending on the period. These sources reflect either direct product sales or revenue-sharing and royalty-type arrangements tied to marketed therapies.
- Royalties and other revenue: typically a small single-source contributor relative to the categories above, but still important because royalty revenue often carries strong margins.
One important feature of PTC’s model is that accounting revenue can swing sharply from year to year because partnership payments are not always recurring in the same way as product sales. That means a single strong year does not automatically represent a new steady earnings base. At the same time, the company has shown that commercial products and deal-making can generate meaningful scale for a biotech of its size.
The income flow over recent years also shows a major shift: revenue rose strongly by 2025, while research spending remained high but became more manageable relative to sales. That helped operating results turn positive for a period, although the improvement has not yet translated into a stable pattern of profitability or cash generation.
Key Figures
| Metric | Value | Sector ⓘ |
|---|---|---|
| Date | Oct 03, 2026 | |
| Context | ||
| Sector | Healthcare | |
| Industry | Biotechnology | |
| Market Cap ⓘ | $5.41B | |
| Beta ⓘ | 0.55 | |
Value (Cheapness) | ||
| P/E Ratio ⓘ | N/A | 24.06 |
| P/B Ratio ⓘ | N/A | 3.08 |
| FCF Yield ⓘ | -6.15% | 3.07% |
| Dividend Yield ⓘ | N/A | 2.05% |
| EBIT / EV ⓘ | 3.22% | 0.63% |
| PEG ⓘ | 0.81 | |
Growth (Business expansion) | ||
| Revenue Growth ⓘ | 101.50% | 7.50% |
| RPS Growth (5Y CAGR) ⓘ | 26.54% | 8.70% |
| EPS Growth (5Y CAGR) ⓘ | N/A | -18.20% |
| BVPS Growth (5Y CAGR) ⓘ | N/A | 3.95% |
| Margin Growth (5Y Trend) ⓘ | N/A | -0.58% |
| FCF Growth (5Y CAGR) ⓘ | N/A | 0.88% |
| DPS Growth (5Y CAGR) ⓘ | N/A | 6.80% |
Quality (Business durability) | ||
| ROIC (Latest) ⓘ | 13.54% | 3.29% |
| ROA (Latest) ⓘ | -1.30% | 3.02% |
| ROIC (5Y Median) ⓘ | -55.10% | 4.75% |
| ROA (5Y Median) ⓘ | -25.27% | 1.93% |
| Net Debt / EBIT (Latest) ⓘ | -2.99 | 1.33 |
| Net Debt / EBIT (5Y Median) ⓘ | N/A | 1.83 |
| Net Debt / EBITDA (Latest) ⓘ | -2.04 | 0.99 |
| Net Debt / Assets ⓘ | -10.87% | 5.33% |
| EBITDA / Interest ⓘ | 0.94 | 9.63 |
| Operating Margin (Latest) ⓘ | 11.72% | 9.25% |
| Operating Margin (5Y Median) ⓘ | -60.45% | 7.80% |
| Debt to Equity (Latest) ⓘ | -421.18% | 28.99% |
| Profit Margin (Latest) ⓘ | -3.81% | 3.60% |
| Free Cash Flow (Latest) ⓘ | -$332.56M | |
Momentum (Price trend) | ||
| 3Y Return ⓘ | +201.93% | +37.48% |
| 12M Return (excl. last month) ⓘ | +43.04% | +20.85% |
| 6M Return ⓘ | -6.72% | +9.73% |
| Price vs. 200-Day MA ⓘ | -11.20% | +4.69% |
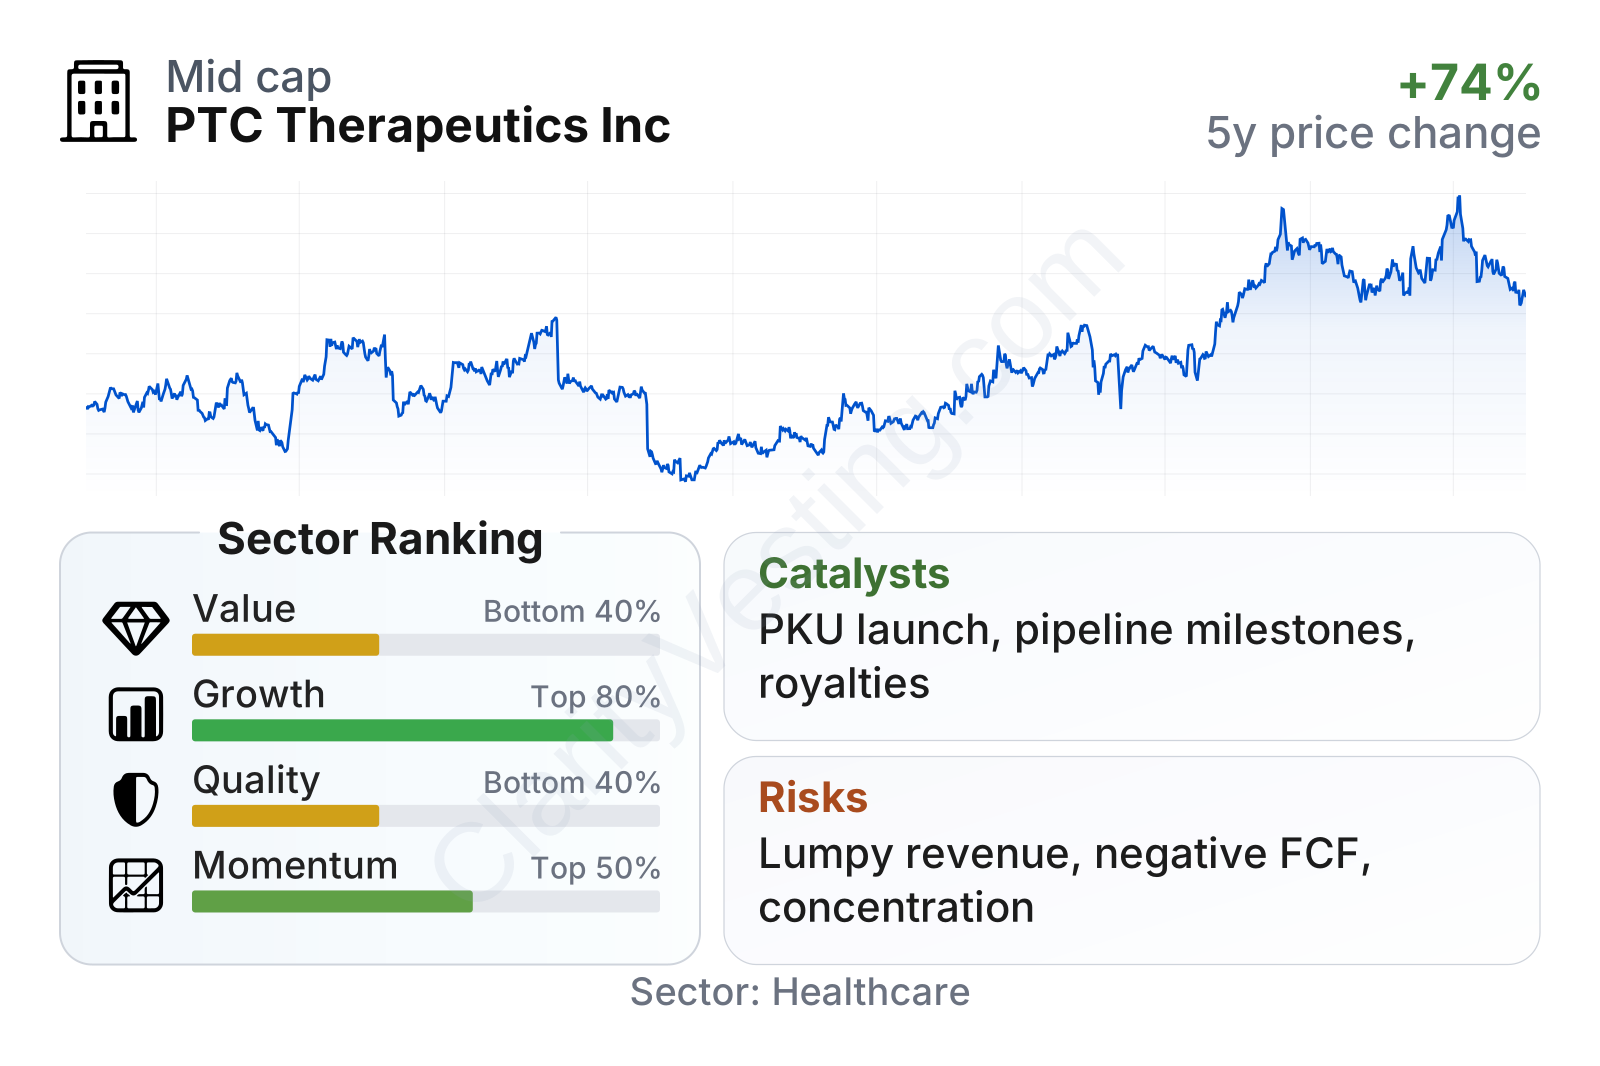
PTC sits in the mid-cap range for biotech and has shown lower share-price volatility than many peers, as reflected by a beta well below 1. The stock’s longer-term performance has been strong, but the path has not been smooth, with sharp moves tied to regulatory events, partner payments, and sentiment around the pipeline.
On growth, the company ranks well above much of the healthcare sector. Revenue growth has been far stronger than the sector median, and five-year revenue-per-share expansion also stands out. On quality and valuation, the picture is more mixed. Recent operating efficiency improved meaningfully, but net profitability and free cash flow remain inconsistent. That combination often describes a biotech transitioning from heavy investment toward a more commercial profile, but not yet fully established there.
Growth
Rare disease biotechnology is a structurally attractive area for growth. These markets are usually smaller in patient numbers, but treatments can command high pricing if they address severe conditions with limited alternatives. Regulatory pathways can also be more supportive than in broader primary-care markets, especially when a therapy addresses a serious unmet need. PTC operates directly in that environment, which gives it access to a sector where successful products can remain commercially important for many years.
Its strategy also makes sense on paper. The company is not relying on only one route to expansion. It has marketed products that can support the business today, a partnership model that can unlock milestone revenue, and a pipeline that can create future launches if clinical and regulatory execution goes well. That is a stronger setup than a pure single-asset biotech, even if it still carries meaningful concentration risk.
Revenue growth has been highly uneven, but the broader pattern shows that PTC can produce very large jumps when a commercial or partnership catalyst lands. The latest year-over-year rebound is far above the sector median, which highlights the company’s ability to generate step changes rather than only gradual growth. The tradeoff is that this kind of profile can reverse quickly when milestone timing shifts or a product trend weakens.
Cash generation tells a more cautious version of the same story. Free cash flow has swung from deeply negative to strongly positive and then back into negative territory. That volatility matters because long-term value in biotech usually depends not just on scientific success, but on whether the company can fund development without repeatedly leaning on new financing or major asset transactions.
A major catalyst in the current setup is the company’s PKU franchise, centered on sepiapterin. If commercialization continues to progress well, it could become an important growth engine because PKU is a well-recognized rare metabolic disease market with existing treatment demand. PTC also continues to have optionality from its broader pipeline and from partnership-related economics, which can produce outsized financial impact in a short period.
Recent company updates have reinforced that PTC is trying to shift from being viewed mainly as a development-stage biotech toward a multi-product rare disease company. That transition is significant because the market often awards higher confidence to businesses with recurring commercial revenue rather than those dependent almost entirely on trial outcomes.
Risks
This article is for informational purposes only and does not constitute financial advice. Some content is AI-generated. See Disclaimer


