Stock Analysis · Chandra Asri Petrochemical (PTCAY)
Overview
Chandra Asri Petrochemical is one of Indonesia’s largest integrated petrochemical producers. The company makes basic chemical building blocks and polymer products that are used in everyday packaging, consumer goods, automotive parts, construction materials, and industrial applications. In practical terms, it sits near the start of many manufacturing supply chains: it processes hydrocarbon feedstocks into chemicals and plastics that other companies turn into finished products.
The group’s business mix has historically been centered on olefins, polyolefins, and styrene-related products, supported by logistics, infrastructure, and downstream activities. Its strategic importance comes from its domestic position in Indonesia, where industrial demand and import substitution can matter as much as pure export competitiveness.
Based on company disclosures, the main revenue sources are broadly structured as follows:
- Olefins: approximately 35% to 45% of revenue in recent years. This category generally includes products such as ethylene, propylene, mixed C4, pyrolysis gasoline, and related upstream petrochemical outputs.
- Polyolefins: approximately 30% to 40% of revenue. This mainly covers polyethylene and polypropylene resins used in packaging, household products, and industrial components.
- Styrene monomer and butadiene-related products: approximately 10% to 20% of revenue, depending on market conditions and product spreads.
- Other chemicals, trading, utilities, tank storage, and infrastructure-related activities: generally a smaller share of revenue, but still relevant to integration and customer relationships.
The business remains highly tied to selling prices for petrochemical products, feedstock costs, and plant utilization. That means revenue can move sharply even when physical volumes are relatively stable. One notable pattern in recent years is that profitability has been much more volatile than sales, showing how exposed the company is to industry cycles and financing costs.
The income flow over the last few years shows a business with large revenue swings but thin room for error. Cost of goods sold absorbs most sales, and interest expense has become much heavier, which has made it harder for operating improvements to translate into strong net profit.
Key Figures
| Metric | Value | Sector ⓘ |
|---|---|---|
| Date | Oct 24, 2026 | |
| Context | ||
| Sector | Basic Materials | |
| Industry | Specialty Chemicals | |
| Market Cap ⓘ | $6.92B | |
| Beta ⓘ | -0.16 | |
Value (Cheapness) | ||
| P/E Ratio ⓘ | 114.29 | 16.92 |
| P/B Ratio ⓘ | 2.34 | 1.66 |
| FCF Yield ⓘ | -7.94% | 5.83% |
| Dividend Yield ⓘ | N/A | 2.07% |
| EBIT / EV ⓘ | 2.63% | 6.38% |
| PEG ⓘ | N/A | |
Growth (Business expansion) | ||
| Revenue Growth ⓘ | 28.50% | 11.25% |
| RPS Growth (5Y CAGR) ⓘ | 34.92% | 4.49% |
| EPS Growth (5Y CAGR) ⓘ | N/A | -15.24% |
| BVPS Growth (5Y CAGR) ⓘ | 3.94% | 5.49% |
| Margin Growth (5Y Trend) ⓘ | 12.01% | -1.54% |
| FCF Growth (5Y CAGR) ⓘ | N/A | 0.37% |
| DPS Growth (5Y CAGR) ⓘ | -12.42% | 5.91% |
Quality (Business durability) | ||
| ROIC (Latest) ⓘ | N/A | 9.59% |
| ROA (Latest) ⓘ | 0.90% | 4.92% |
| ROIC (5Y Median) ⓘ | 0.76% | 7.91% |
| ROA (5Y Median) ⓘ | -0.64% | 3.92% |
| Net Debt / EBIT (Latest) ⓘ | 9.85 | 1.36 |
| Net Debt / EBIT (5Y Median) ⓘ | 1.75 | 1.69 |
| Net Debt / EBITDA (Latest) ⓘ | 5.14 | 0.93 |
| Net Debt / Assets ⓘ | 21.72% | 13.69% |
| EBITDA / Interest ⓘ | 1.80 | 12.38 |
| Operating Margin (Latest) ⓘ | 3.22% | 13.24% |
| Operating Margin (5Y Median) ⓘ | 2.48% | 11.82% |
| Debt to Equity (Latest) ⓘ | 149.24% | 40.30% |
| Profit Margin (Latest) ⓘ | 1.19% | 6.38% |
| Free Cash Flow (Latest) ⓘ | -$549.50M | |
Momentum (Price trend) | ||
| 3Y Return ⓘ | -41.14% | +73.47% |
| 12M Return (excl. last month) ⓘ | -85.95% | +27.59% |
| 6M Return ⓘ | -85.95% | -4.02% |
| Price vs. 200-Day MA ⓘ | N/A | -0.65% |
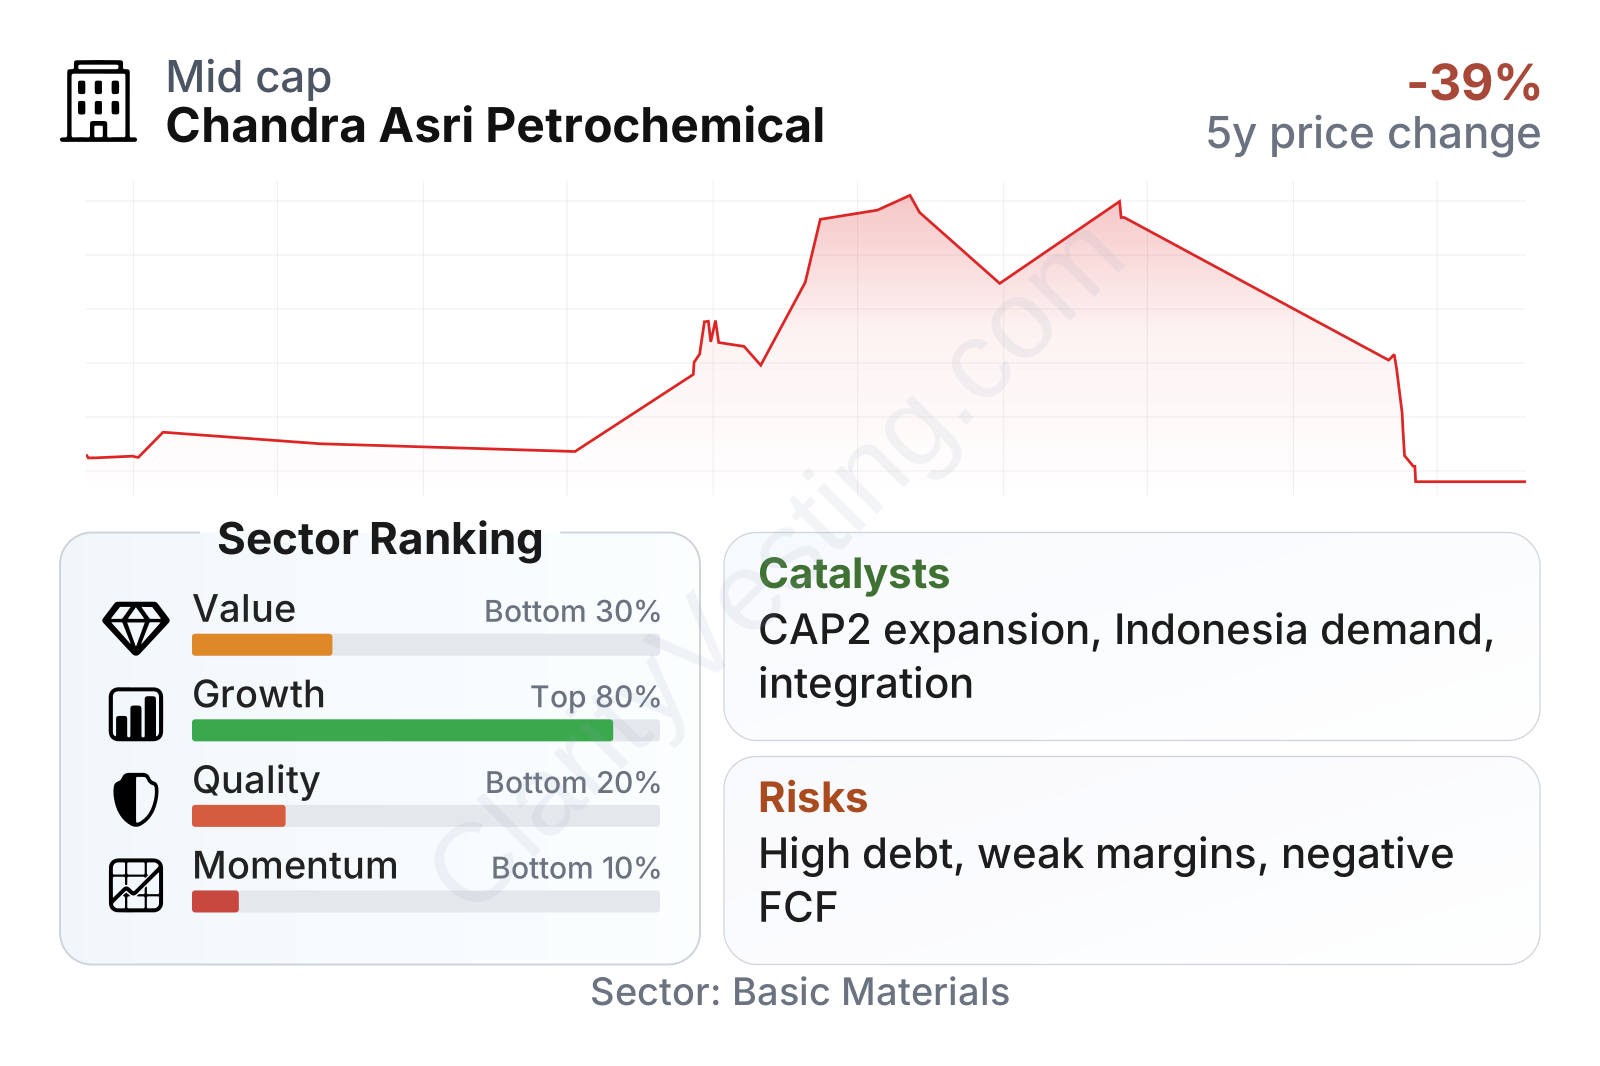
The overall picture is mixed. Growth metrics rank well versus much of the sector, helped by strong revenue expansion and better operating margin direction over several years. However, quality, balance sheet strength, and stock momentum rank weakly. The company is now in a position where business scale is improving, but returns, leverage, and cash generation still lag far behind many peers.
Chandra Asri is a mid-to-large regional chemicals company by market value, but its current profitability remains thin. Recent metrics point to low returns on assets, elevated net debt relative to earnings, weak interest coverage, and negative free cash flow. Those figures matter because petrochemicals is a capital-intensive industry, so balance sheet pressure can quickly become a central issue when margins compress.
Growth
Chandra Asri operates in a sector that should benefit over the long run from rising consumption in Southeast Asia, especially in Indonesia. Plastics, packaging, consumer products, infrastructure, and manufacturing all depend on petrochemical feedstocks and resins. Indonesia’s large population and industrial development support the logic for domestic capacity growth, particularly when the country still relies on imports for part of its chemical needs.
The company’s strategy also has a clear industrial rationale: deepen integration, increase domestic supply, improve logistics and infrastructure, and expand into adjacent value chains. That approach can make sense in a market where local presence, scale, and feedstock access can shape long-term economics. Chandra Asri has also been building its position through major projects and partnerships intended to broaden capacity and improve Indonesia’s self-sufficiency in petrochemicals and related materials.
Revenue growth has been solid recently, including a clear rebound in the latest period. Over five years, revenue per share growth has been much stronger than the sector median. That said, in this industry, top-line growth alone does not guarantee value creation; what matters is whether new revenue comes with healthier spreads and better cash conversion.
That is where the current growth profile becomes more complicated. Free cash flow has moved from modestly positive to deeply negative, suggesting expansion spending and working-capital needs are consuming cash. For a long-term business case, future growth likely depends on turning today’s investment phase into higher utilization, better margins, and steadier cash generation later on.
Recent corporate developments have also pointed to a broader industrial platform rather than a narrow commodity chemicals producer. The group has highlighted expansion initiatives tied to petrochemical capacity, infrastructure, and downstream opportunities. If execution stays on track, the most important catalyst is not a single quarter of earnings improvement, but the possibility of becoming a larger, more integrated domestic chemicals and industrial infrastructure player.
Risks
This article is for informational purposes only and does not constitute financial advice. Some content is AI-generated. See Disclaimer


