Stock Analysis · Port of Tauranga Limited (PTAUF)
Overview
Port of Tauranga Limited is New Zealand’s largest port by freight volume and a key gateway for the country’s import and export trade. The company operates marine services, cargo handling, storage, logistics links, and property assets around the Port of Tauranga. In simple terms, it earns money by moving goods through the port, charging for the use of port infrastructure, and providing related services that help cargo travel between ships, trucks, warehouses, and inland freight hubs.
The business is tied closely to New Zealand’s trade flows. Export cargo such as logs, dairy, kiwifruit, and manufactured products, along with imported containers and bulk goods, all contribute to activity. The port is especially important for the Upper North Island, which is the country’s largest population and consumption region, and it also connects with inland freight hubs that extend its reach beyond the waterfront.
Based on company reporting, revenue is mainly generated from a mix of port operations, cargo services, and property or ancillary activities. The exact split can vary by year, but the broad structure is as follows:
- Marine and cargo services: approximately 70% to 80% of revenue. This includes ship handling, berthage, wharfage, cargo handling, and other charges linked directly to vessels and freight moving through the port.
- Storage, logistics, and related port services: approximately 15% to 25% of revenue. This covers container services, terminal activities, inland freight connections, and other operational support services.
- Property, rentals, and other income: approximately 5% to 10% of revenue. This generally includes land leases, rental income, and smaller supporting revenue streams.
What stands out in this model is the combination of infrastructure-like characteristics and trade exposure. Ports are hard to replicate because they require land, permits, transport connections, and long-term customer relationships. At the same time, cargo volumes still move up and down with the economy, shipping patterns, and commodity demand.
The recent financial flow also shows a business with strong gross profitability and unusually high operating margins for the broader transport space. Revenue has generally trended upward over the past several years, while cost of revenue has stayed comparatively controlled, helping profitability remain resilient even when cargo conditions have been mixed.
Over the last five fiscal years, revenue rose from the mid-300 million range to above 430 million, while gross profit stayed consistently strong. Profitability peaked in fiscal 2025 and remained elevated in fiscal 2026 despite some revenue easing, suggesting the company still benefits from pricing power, efficient assets, and a favorable mix of higher-value services.
Key Figures
| Metric | Value | Sector ⓘ |
|---|---|---|
| Date | Oct 24, 2026 | |
| Context | ||
| Sector | Industrials | |
| Industry | Marine Shipping | |
| Market Cap ⓘ | $3.33B | |
| Beta ⓘ | 0.38 | |
Value (Cheapness) | ||
| P/E Ratio ⓘ | 32.60 | 22.29 |
| P/B Ratio ⓘ | 1.43 | 1.98 |
| FCF Yield ⓘ | N/A | 6.26% |
| Dividend Yield ⓘ | 4.19% | 1.92% |
| EBIT / EV ⓘ | 4.47% | 4.83% |
| PEG ⓘ | 6.37 | |
Growth (Business expansion) | ||
| Revenue Growth ⓘ | 1.10% | 9.30% |
| RPS Growth (5Y CAGR) ⓘ | 3.74% | 7.76% |
| EPS Growth (5Y CAGR) ⓘ | -3.12% | -13.17% |
| BVPS Growth (5Y CAGR) ⓘ | 2.85% | 6.13% |
| Margin Growth (5Y Trend) ⓘ | 10.31% | 0.74% |
| FCF Growth (5Y CAGR) ⓘ | -0.91% | 10.79% |
| DPS Growth (5Y CAGR) ⓘ | 5.91% | 9.41% |
Quality (Business durability) | ||
| ROIC (Latest) ⓘ | N/A | 10.75% |
| ROA (Latest) ⓘ | N/A | 5.41% |
| ROIC (5Y Median) ⓘ | 6.44% | 9.37% |
| ROA (5Y Median) ⓘ | 4.61% | 4.95% |
| Net Debt / EBIT (Latest) ⓘ | N/A | 2.04 |
| Net Debt / EBIT (5Y Median) ⓘ | 2.25 | 2.27 |
| Net Debt / EBITDA (Latest) ⓘ | N/A | 1.39 |
| Net Debt / Assets ⓘ | 14.96% | 19.27% |
| EBITDA / Interest ⓘ | N/A | 9.58 |
| Operating Margin (Latest) ⓘ | N/A | 10.49% |
| Operating Margin (5Y Median) ⓘ | 46.56% | 10.30% |
| Debt to Equity (Latest) ⓘ | N/A | 64.82% |
| Profit Margin (Latest) ⓘ | 32.08% | 6.67% |
| Free Cash Flow (Latest) ⓘ | N/A | |
Momentum (Price trend) | ||
| 3Y Return ⓘ | +50.87% | +67.77% |
| 12M Return (excl. last month) ⓘ | +30.17% | +12.05% |
| 6M Return ⓘ | +3.86% | 0.00% |
| Price vs. 200-Day MA ⓘ | +3.88% | +0.67% |
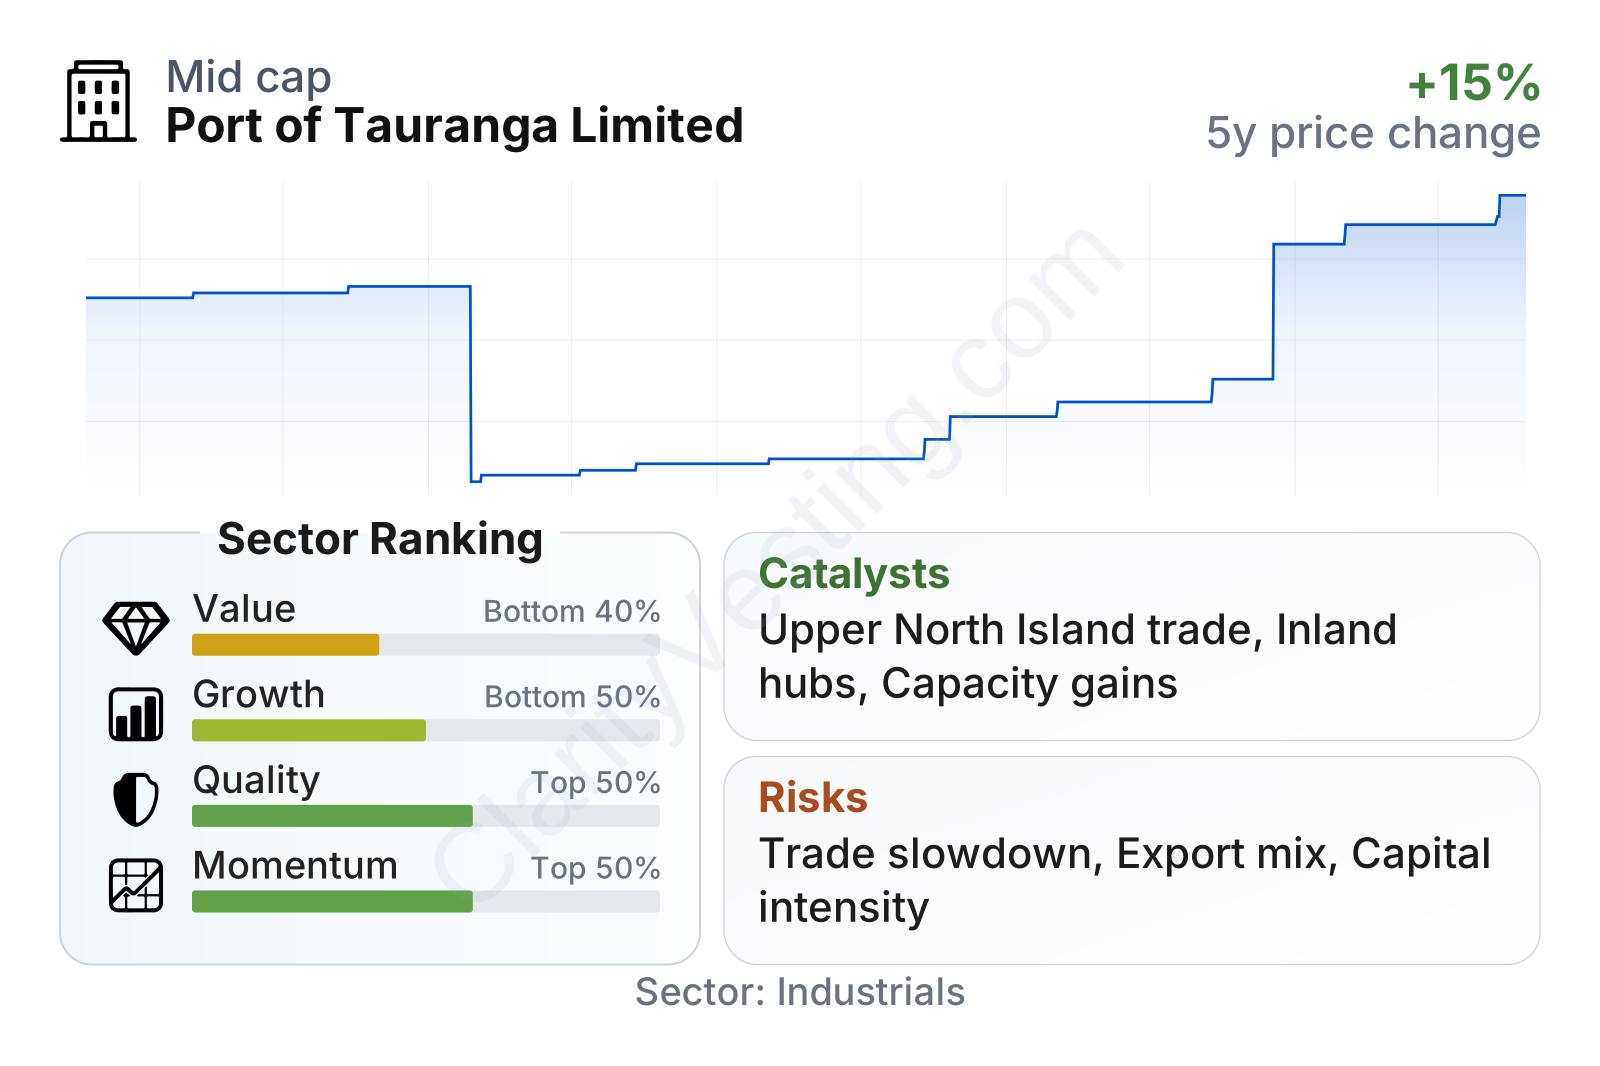
Port of Tauranga sits in the larger end of the New Zealand listed market, with a low beta of about 0.4, meaning the stock has historically moved less than the broader market. The share price trend has been constructive over the last year, and medium-term momentum is better than much of the sector, although the three-year return is not exceptional compared with industrial peers.
From a fundamental standpoint, the picture is mixed. Profit margin is very strong at roughly 32%, clearly above the sector median, and the balance sheet does not appear stretched, with net debt equal to about 15% of assets. Debt levels look manageable for an infrastructure business. Operating margins over several years have also been unusually strong relative to the broader sector, which supports the idea that this is a high-quality port asset rather than a low-margin shipping operator.
At the same time, growth metrics are softer. Recent revenue growth was close to 1%, well below the sector median, and five-year revenue-per-share growth has also been modest. Free cash flow has been less consistent than accounting profit, which matters because ports require continuing capital investment in land, channels, equipment, and freight connections. On valuation, the stock trades on a price-to-earnings multiple above the sector median, while the price-to-book ratio is lower than average. That combination usually points to a business the market sees as stable and profitable, but not obviously cheap relative to its current growth rate.
Growth
Port infrastructure is not a fast-growth industry in the way software or biotech can be, but it can be an attractive long-duration sector because trade networks, logistics bottlenecks, and scarce physical assets tend to retain importance over decades. In Port of Tauranga’s case, the long-term backdrop is supported by New Zealand’s dependence on seaborne trade and the economic weight of the North Island. As population, consumption, and freight demand increase over time, efficient ports should remain essential.
The company’s strategy appears sensible for that environment. Rather than relying only on ship calls at the waterfront, it has built a wider network that includes inland freight hubs and logistics connections. That matters because modern port competition is no longer just about who has the dock; it is also about who can move containers and bulk cargo efficiently through the whole supply chain. A port that is deeply integrated into rail, road, warehousing, and inland terminals can defend volumes better than one that only provides quay access.
Another favorable point is the nature of the asset base. Major ports are difficult and expensive to expand or duplicate, especially when environmental approvals, land constraints, and community opposition are considered. This gives established operators a barrier to entry that can support returns over long periods. Port of Tauranga’s position as the country’s largest freight port gives it relevance with shipping lines and exporters that smaller facilities may struggle to match.
Recent operating results suggest there is still earnings power even without rapid top-line growth. Revenue in fiscal 2026 was lower than fiscal 2025, but profit remained historically strong. That can indicate good cost control, pricing discipline, favorable cargo mix, or support from associated businesses and investments. For long-term analysis, that resilience matters because it shows the business is not wholly dependent on high volume growth to produce solid earnings.
Potential catalysts include continued growth in containerized trade, improving freight efficiency through inland connections, and any recovery in export volumes after weaker periods in some commodity categories. Capacity upgrades, channel improvements, and terminal productivity gains can also lift earnings over time by allowing more cargo to move through the same core footprint. If New Zealand trade patterns remain concentrated around the Upper North Island, Port of Tauranga is positioned to benefit.
Risks
This article is for informational purposes only and does not constitute financial advice. Some content is AI-generated. See Disclaimer


