Stock Analysis · Pershing Square Holdings Ltd (PSHZF)
Overview
Pershing Square Holdings Ltd is a publicly listed investment holding company that gives shareholders access to the concentrated portfolio managed by Pershing Square Capital Management, the firm founded by Bill Ackman. In simple terms, it is not an operating business that sells products or services to consumers. Its main activity is investing shareholder capital in a limited number of large public companies, while also using some hedging and financing tools to manage risk and returns.
Because of that structure, its results depend mostly on how the underlying portfolio performs rather than on traditional sales growth. The company’s annual reports describe income primarily through investment gains, dividends, and other investment-related items. Revenue can swing sharply from year to year because market prices of holdings move continuously.
The main sources of revenue and investment income are generally:
- Net gains on investments: usually the dominant driver, often representing well above 50% of total income in strong years. This includes realized gains from selling positions and unrealized gains from changes in market value.
- Dividend income from portfolio companies: a smaller but recurring source tied to the listed companies it owns.
- Interest and other investment-related income: cash balances, short-term instruments, and certain structured positions can add a modest contribution.
- Hedging or derivative impacts: these can either add to or reduce income depending on market conditions, interest rates, and specific portfolio protection strategies.
The business model is unusual compared with most financial stocks. Pershing Square Holdings is closer to a listed investment vehicle than to a traditional asset manager that earns steady fees based on client assets. That makes the company easier to understand at a high level: long-term value is driven mainly by growth in net asset value per share and by whether the market price trades at a discount or premium to that underlying value.
The multi-year profit flow shows exactly that pattern: earnings can be extremely strong in one year and negative in another, even without a fundamental change in the structure of the business. What stands out more positively is that book value and earnings power have recovered well since the 2022 drawdown, reflecting the impact of successful portfolio concentration when holdings perform.
Key Figures
| Metric | Value | Sector ⓘ |
|---|---|---|
| Date | Oct 17, 2026 | |
| Context | ||
| Sector | Financial Services | |
| Industry | Asset Management | |
| Market Cap ⓘ | $12.32B | |
| Beta ⓘ | 0.53 | |
Value (Cheapness) | ||
| P/E Ratio ⓘ | 4.10 | 12.26 |
| P/B Ratio ⓘ | 0.68 | 1.23 |
| FCF Yield ⓘ | 1.79% | 10.40% |
| Dividend Yield ⓘ | 1.40% | 3.02% |
| EBIT / EV ⓘ | N/A | 8.14% |
| PEG ⓘ | N/A | |
Growth (Business expansion) | ||
| Revenue Growth ⓘ | 19.50% | 9.35% |
| RPS Growth (5Y CAGR) ⓘ | 13.15% | 12.19% |
| EPS Growth (5Y CAGR) ⓘ | 21.58% | -9.53% |
| BVPS Growth (5Y CAGR) ⓘ | 10.03% | 4.99% |
| Margin Growth (5Y Trend) ⓘ | -147.16% | -3.86% |
| FCF Growth (5Y CAGR) ⓘ | N/A | 4.81% |
| DPS Growth (5Y CAGR) ⓘ | 13.88% | 8.79% |
Quality (Business durability) | ||
| ROIC (Latest) ⓘ | N/A | 9.49% |
| ROE (Latest) ⓘ | 11.66% | 13.90% |
| ROA (Latest) ⓘ | 9.10% | 1.55% |
| ROIC (5Y Median) ⓘ | N/A | 7.86% |
| ROE (5Y Median) ⓘ | 18.38% | 12.17% |
| ROA (5Y Median) ⓘ | 14.74% | 1.30% |
| Net Debt / EBIT (Latest) ⓘ | N/A | 0.96 |
| Net Debt / EBIT (5Y Median) ⓘ | 0.48 | 0.73 |
| Net Debt / EBITDA (Latest) ⓘ | N/A | 0.92 |
| Operating Margin (Latest) ⓘ | N/A | 22.30% |
| Operating Margin (5Y Median) ⓘ | 79.41% | 24.63% |
| Debt to Equity (Latest) ⓘ | 28.00% | 58.56% |
| Profit Margin (Latest) ⓘ | N/A | 26.57% |
| Free Cash Flow (Latest) ⓘ | $220.42M | |
Momentum (Price trend) | ||
| 3Y Return ⓘ | +43.23% | +88.33% |
| 12M Return (excl. last month) ⓘ | -20.67% | +19.38% |
| 6M Return ⓘ | -13.20% | +4.75% |
| Price vs. 200-Day MA ⓘ | -7.98% | +3.50% |
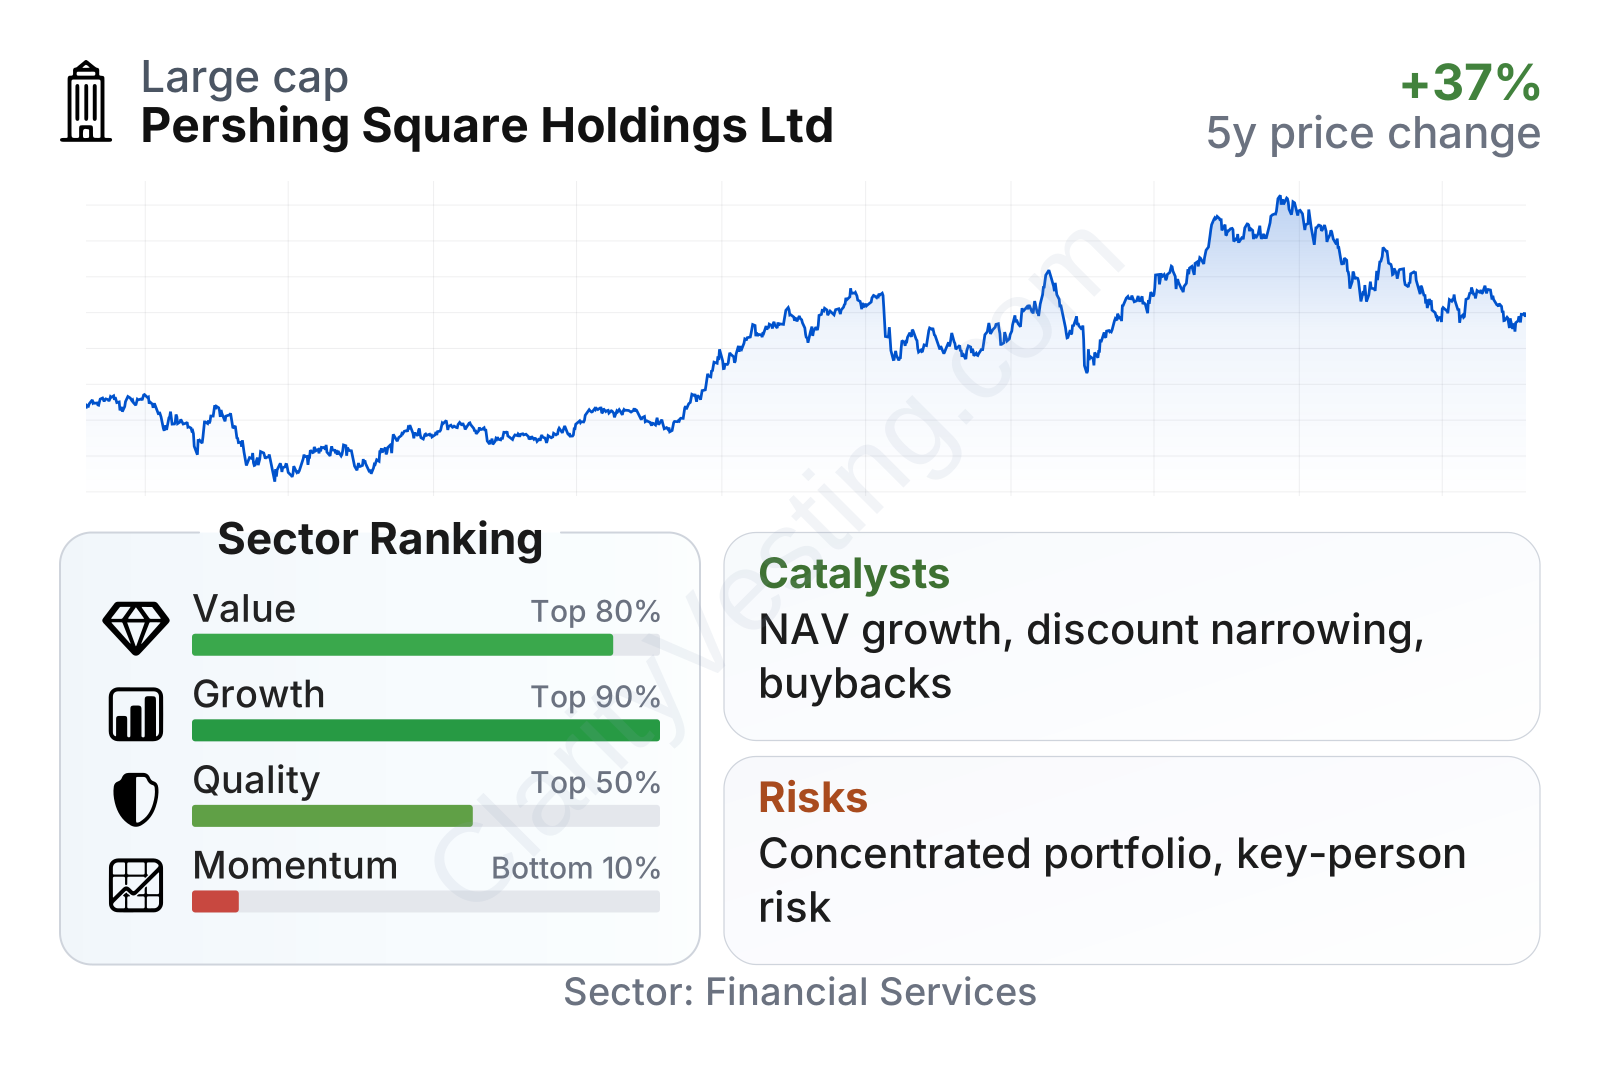
Pershing Square Holdings sits in the large-cap range and its share price has been less volatile than many financial stocks, as shown by a beta well below 1. The factor summary is mixed but interesting. Value metrics screen favorably, with both earnings and book-based multiples below sector norms. Growth metrics are particularly strong relative to the broader financial sector, while quality is around the middle of the pack overall despite some very strong asset-efficiency measures. The weak spot is momentum: recent share-price performance has lagged the sector, which helps explain why the valuation remains restrained.
Growth
For long-term analysis, the relevant growth question is not whether Pershing Square Holdings operates in a fast-expanding industry, but whether its structure can compound capital over time. In that sense, the company sits in a favorable niche. Public markets continue to reward disciplined capital allocation, and listed vehicles that provide access to concentrated, high-conviction portfolios remain differentiated from broad passive products. The company’s strategy is simple and scalable: keep a focused list of large investments, engage actively where useful, and look for asymmetric opportunities.
Its recent record supports that framework. Revenue growth over the last year has been stronger than the sector median, and five-year growth in earnings per share and book value per share has also outpaced the median financial company. That matters because book value per share is especially important here: for an investment company, long-term value creation is closely tied to growth in net assets on a per-share basis.
The earnings trend highlights the upside and the volatility of the model. Earnings per share rose sharply from 2024 to mid-2025, showing how quickly results can improve when major holdings appreciate and portfolio actions work. This is not the kind of company where smooth quarterly progression should be expected; what matters more is whether the portfolio is creating value across full market cycles.
Book value per share has moved up materially from the 2022 reset and reached a meaningfully higher level by 2025. That is one of the clearest positive signals in the whole profile. It suggests that the portfolio has not only recovered from prior market weakness but has compounded beyond earlier levels, which is central to the long-term case.
A notable catalyst is the company’s continued effort to narrow the discount between its share price and net asset value. Pershing Square Holdings has used share repurchases in prior periods and has repeatedly highlighted the discount as an area of focus in shareholder communications. If net asset value continues to rise while the discount narrows, shareholder returns can benefit from two engines at once: portfolio performance and multiple re-rating.
Another catalyst is the company’s ability to deploy capital into a small number of high-conviction ideas. That concentration can create outsized gains when the thesis is right. The same feature increases risk, but it also explains why the company can materially outperform more diversified financial firms in strong periods.
Risks
This article is for informational purposes only and does not constitute financial advice. Some content is AI-generated. See Disclaimer


