Stock Analysis · Prospect Capital Corporation (PSEC)
Overview
Prospect Capital Corporation is a business development company, or BDC. In simple terms, it is a publicly traded lender and investor focused mainly on middle-market companies in the United States. These are businesses that are usually too large for small-bank lending but too small to access the bond market on attractive terms. Prospect provides loans, makes structured credit investments, and in some cases takes equity stakes. Because of its BDC structure, the company is designed to pass through most of its income to shareholders through distributions.
The business model is centered on earning income from a portfolio of investments rather than from selling products or services in the traditional sense. The largest source of revenue is usually interest income from debt investments, with additional contributions from fee income, dividend income from equity holdings, and realized or unrealized gains and losses from portfolio valuations and exits. In Prospect’s case, the mix can swing meaningfully from year to year because fair-value changes on investments can materially affect reported results.
Based on the company’s recent filings, Prospect’s investment portfolio is broadly diversified by industry and asset type, but first-lien and other secured lending remain the core of the platform. A simplified breakdown of the business looks like this:
- Interest income from loans and structured credit: the dominant source of recurring revenue, generated from directly originated loans, secured debt, and other income-producing investments.
- Dividend income: cash distributions received from certain equity and structured holdings.
- Fee income: origination, structuring, and related fees tied to underwriting and portfolio activity.
- Valuation gains or losses: changes in the fair value of investments, which can significantly lift or reduce reported earnings in a given period.
For long-term analysis, the key point is that Prospect is less a conventional asset manager and more an income-oriented balance-sheet investor. That means portfolio quality, credit performance, funding costs, and net asset value matter more than headline revenue alone.
The operating picture has been volatile over the last several years. Reported revenue and net income have swung sharply, reflecting how much valuation movements can influence results. The latest period shows a rebound in revenue and profitability, but the path has not been smooth enough to treat one strong year as a stable baseline.
Key Figures
| Metric | Value | Sector ⓘ |
|---|---|---|
| Date | Oct 17, 2026 | |
| Context | ||
| Sector | Financial Services | |
| Industry | Asset Management | |
| Market Cap ⓘ | $1.11B | |
| Beta ⓘ | 0.79 | |
Value (Cheapness) | ||
| P/E Ratio ⓘ | 34.67 | 12.26 |
| P/B Ratio ⓘ | 0.22 | 1.23 |
| FCF Yield ⓘ | 33.89% | 10.40% |
| Dividend Yield ⓘ | 24.53% | 3.02% |
| EBIT / EV ⓘ | N/A | 8.14% |
| PEG ⓘ | 1.55 | |
Growth (Business expansion) | ||
| Revenue Growth ⓘ | -6.70% | 9.35% |
| RPS Growth (5Y CAGR) ⓘ | -5.98% | 12.19% |
| EPS Growth (5Y CAGR) ⓘ | -6.05% | -9.53% |
| BVPS Growth (5Y CAGR) ⓘ | -0.29% | 4.99% |
| Margin Growth (5Y Trend) ⓘ | -103.87% | -3.86% |
| FCF Growth (5Y CAGR) ⓘ | N/A | 4.81% |
| DPS Growth (5Y CAGR) ⓘ | 2.92% | 8.79% |
Quality (Business durability) | ||
| ROIC (Latest) ⓘ | N/A | 9.49% |
| ROE (Latest) ⓘ | 4.09% | 13.90% |
| ROA (Latest) ⓘ | 2.35% | 1.55% |
| ROIC (5Y Median) ⓘ | 2.89% | 7.86% |
| ROE (5Y Median) ⓘ | 4.10% | 12.17% |
| ROA (5Y Median) ⓘ | 2.32% | 1.30% |
| Net Debt / EBIT (Latest) ⓘ | N/A | 0.96 |
| Net Debt / EBIT (5Y Median) ⓘ | 5.45 | 0.73 |
| Net Debt / EBITDA (Latest) ⓘ | 6.41 | 0.92 |
| Operating Margin (Latest) ⓘ | N/A | 22.30% |
| Operating Margin (5Y Median) ⓘ | 94.12% | 24.63% |
| Debt to Equity (Latest) ⓘ | 41.32% | 58.56% |
| Profit Margin (Latest) ⓘ | 24.03% | 26.57% |
| Free Cash Flow (Latest) ⓘ | $376.34M | |
Momentum (Price trend) | ||
| 3Y Return ⓘ | -44.85% | +88.33% |
| 12M Return (excl. last month) ⓘ | -9.79% | +19.38% |
| 6M Return ⓘ | -14.01% | +4.75% |
| Price vs. 200-Day MA ⓘ | -9.87% | +3.50% |
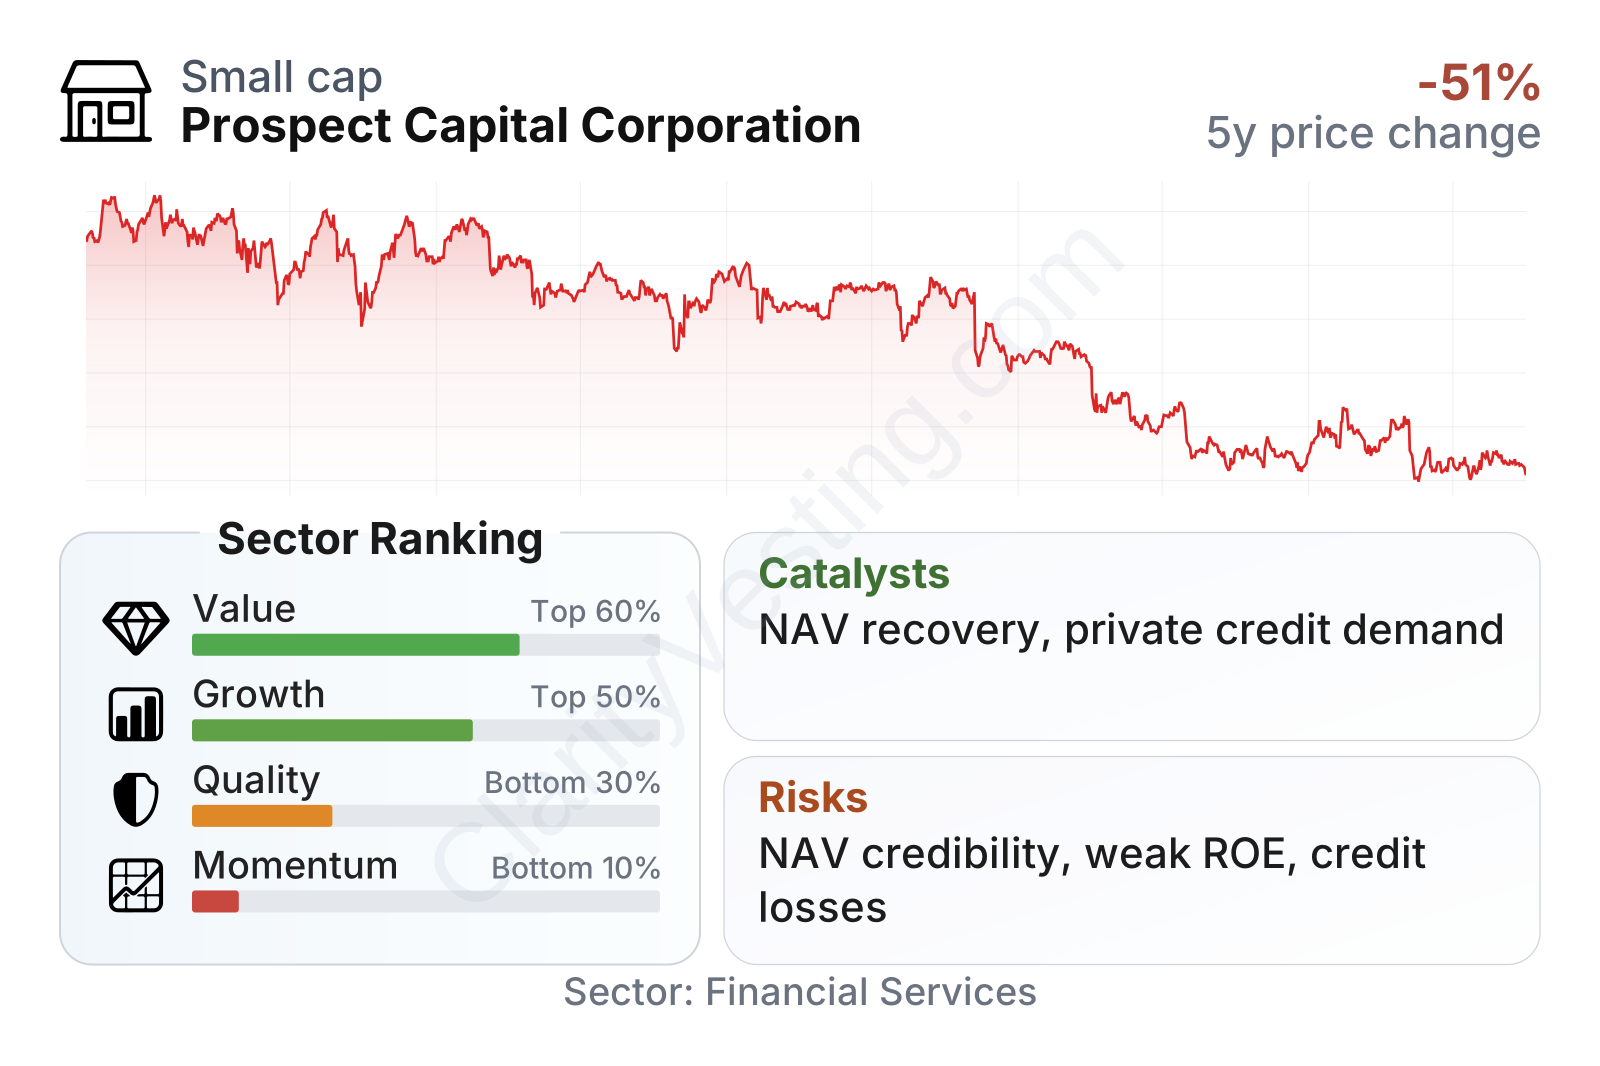
Prospect is a relatively small public financial company, with a market value a little above $1 billion, and its share-price volatility has been lower than the broader market based on beta. The valuation profile looks unusual at first glance: the earnings multiple is high versus the sector median, while the price-to-book ratio is extremely low. That combination usually signals that the market is placing limited confidence in the reported book value or in the sustainability of earnings.
On income measures, the stock stands out for a very high trailing dividend yield and a free-cash-flow yield well above the sector median. However, the company ranks weakly on quality and especially on momentum. Growth metrics are mixed: earnings have held up better than many peers over five years, but revenue per share and recent revenue growth have trended lower, and book value growth has been essentially flat to slightly negative over that period.
Growth
Prospect operates in a part of finance that has long-term relevance. Private credit and middle-market lending have expanded as banks have pulled back from some forms of lending due to regulation, capital constraints, and changing risk appetite. That broader trend supports the need for non-bank lenders such as BDCs. In that sense, the sector still has a credible long-term growth runway.
Prospect’s strategy also makes sense in principle. A diversified portfolio of directly originated loans, structured credit, and selective equity investments can produce recurring income and spread risk across many borrowers and industries. If credit underwriting is disciplined and funding remains available at reasonable cost, this model can scale over time. The company has also emphasized asset coverage, diversification, and secured lending, which are sensible priorities in a credit-focused business.
Even so, the earnings pattern has softened. After stronger results earlier in the period, earnings per share have moved lower in the last two fiscal years. That does not automatically mean the business model is broken, but it does suggest pressure from some combination of credit costs, investment marks, portfolio rotation, or funding conditions. For a lender like Prospect, consistent earnings power matters because it supports both distributions and book value stability.
Book value per share is especially important for BDCs because it acts as a rough anchor for portfolio value over time. Here, the picture is mixed but recently improved. Book value fell materially through fiscal 2025, then recovered sharply in fiscal 2026. That rebound is encouraging because it suggests portfolio values and earnings support improved, but one year of recovery follows a meaningful erosion and does not yet erase the longer-term inconsistency.
A practical growth catalyst would be a sustained period of stable or rising net asset value, combined with steady net investment income and fewer large valuation swings. Another positive catalyst would be continued strength in private credit demand, especially if Prospect can originate higher-quality loans at attractive yields while keeping non-accruals under control. Recent company disclosures also point to active portfolio management and ongoing capital structure actions, which can help if they reduce financing pressure and improve portfolio mix.
Risks
This article is for informational purposes only and does not constitute financial advice. Some content is AI-generated. See Disclaimer


