Stock Analysis · Pershing Square Inc (PS)
Overview
Pershing Square Inc is an asset management company built around a concentrated, activist investing approach. In simple terms, it manages capital by taking sizable positions in a limited number of public companies and trying to increase their value over time through research, engagement with management teams, and long holding periods. The business is closely associated with Bill Ackman and the Pershing Square platform.
Its economics are different from a traditional diversified fund manager with dozens of products. Results depend heavily on the performance of a relatively small portfolio, on capital raised into its vehicles, and on fees linked to assets under management and, where applicable, investment performance. That can make reported revenue and profit more volatile than at larger, more diversified asset managers.
The main revenue sources are broadly the following:
- Investment management and advisory fees: the core recurring source of revenue, generated from managing Pershing Square’s investment vehicles and other advisory arrangements. This is the most stable part of the model.
- Performance-related income and investment gains: a potentially large but variable source tied to returns, portfolio marks, and realized gains. In some periods this can materially lift revenue; in weaker markets it can fall sharply or reverse.
- Other income: smaller items such as interest and miscellaneous investment-related income.
Because Pershing Square’s public reporting does not present a simple consumer-style segment split with fixed percentages, a precise revenue mix by source is not reliably available in a standardized form. What is visible is that the company remains highly dependent on the economics of one investment platform rather than a wide menu of products.
The business is also relatively asset-light operationally, but compensation and administrative costs can swing significantly when the firm expands, launches new initiatives, or records incentive-related expenses. The operating flow shows that revenue increased meaningfully from 2024 to 2025, but expenses rose even faster, pushing operating results deeper into the red despite higher gross profit.
Key Figures
| Metric | Value | Sector ⓘ |
|---|---|---|
| Date | Oct 03, 2026 | |
| Context | ||
| Sector | Financial Services | |
| Industry | Asset Management | |
| Market Cap ⓘ | $22.38B | |
| Beta ⓘ | N/A | |
Value (Cheapness) | ||
| P/E Ratio ⓘ | N/A | 12.60 |
| P/B Ratio ⓘ | 16.21 | 1.23 |
| FCF Yield ⓘ | -0.52% | 10.16% |
| Dividend Yield ⓘ | N/A | 2.96% |
| EBIT / EV ⓘ | -0.47% | 7.77% |
| PEG ⓘ | N/A | |
Growth (Business expansion) | ||
| Revenue Growth ⓘ | 1.90% | 9.50% |
| RPS Growth (5Y CAGR) ⓘ | N/A | 12.10% |
| EPS Growth (5Y CAGR) ⓘ | N/A | -9.45% |
| BVPS Growth (5Y CAGR) ⓘ | N/A | 5.01% |
| Margin Growth (5Y Trend) ⓘ | N/A | -4.07% |
| FCF Growth (5Y CAGR) ⓘ | N/A | 4.96% |
| DPS Growth (5Y CAGR) ⓘ | N/A | 8.79% |
Quality (Business durability) | ||
| ROIC (Latest) ⓘ | N/A | 9.60% |
| ROE (Latest) ⓘ | 1.37% | 13.84% |
| ROA (Latest) ⓘ | 1.07% | 1.53% |
| ROIC (5Y Median) ⓘ | N/A | 7.86% |
| ROE (5Y Median) ⓘ | N/A | 12.20% |
| ROA (5Y Median) ⓘ | N/A | 1.29% |
| Net Debt / EBIT (Latest) ⓘ | N/A | 0.91 |
| Net Debt / EBIT (5Y Median) ⓘ | N/A | 0.74 |
| Net Debt / EBITDA (Latest) ⓘ | N/A | 0.97 |
| Operating Margin (Latest) ⓘ | -12.28% | 22.12% |
| Operating Margin (5Y Median) ⓘ | N/A | 24.39% |
| Debt to Equity (Latest) ⓘ | 18.59% | 60.37% |
| Profit Margin (Latest) ⓘ | 2.09% | 26.62% |
| Free Cash Flow (Latest) ⓘ | -$116.44M | |
Momentum (Price trend) | ||
| 3Y Return ⓘ | N/A | +89.23% |
| 12M Return (excl. last month) ⓘ | N/A | +17.35% |
| 6M Return ⓘ | N/A | +10.00% |
| Price vs. 200-Day MA ⓘ | N/A | +3.73% |
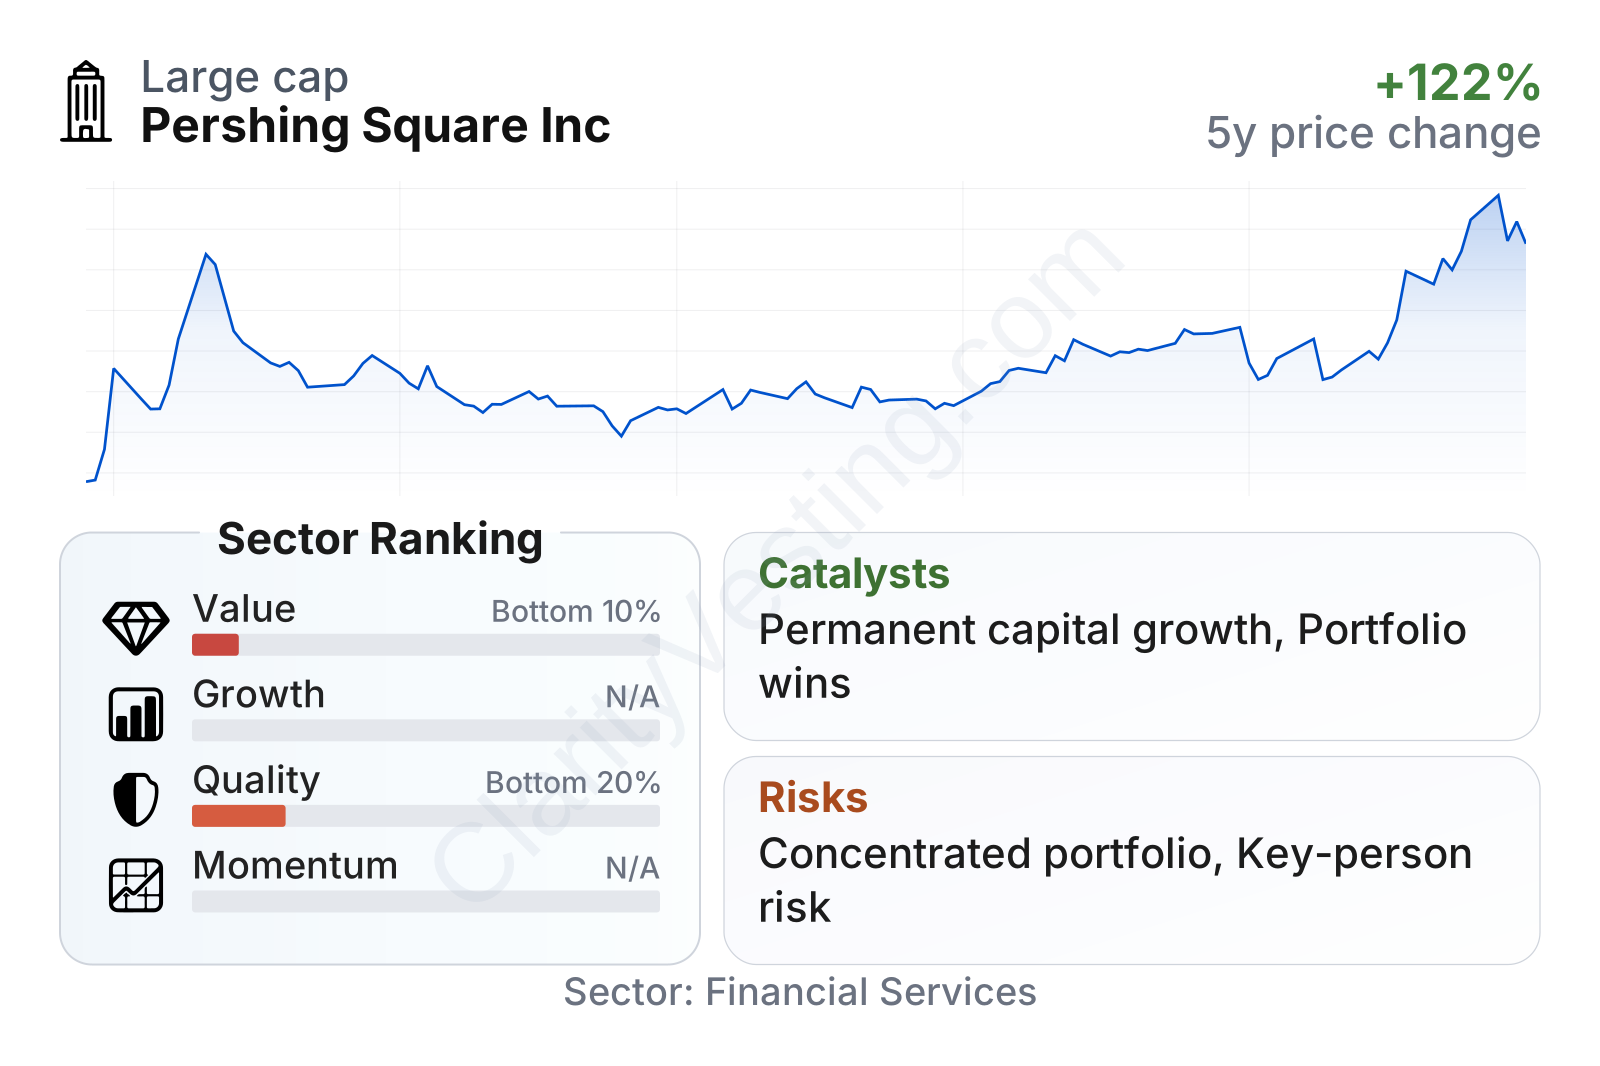
Pershing Square sits in the large-cap range, but its profile is unusual for the financial sector. On the positive side, balance-sheet leverage looks moderate, with debt-to-equity around 19%, which is well below the sector median. On the weaker side, profitability and valuation metrics stand out for the opposite reason: returns on equity and assets are modest, operating margin is negative, free cash flow is negative, and the stock trades at a price-to-book multiple far above most financial peers. Revenue growth has been positive, but recent year-over-year expansion has trailed the sector median, showing that scale alone has not translated into broad-based operating efficiency.
Growth
Asset management remains a structurally relevant industry because retirement savings, institutional allocations, and demand for professionally managed capital continue to grow over time. Within that larger market, Pershing Square operates in a narrower niche: concentrated, high-conviction public equity investing with an activist element. That niche is not the largest part of the industry, but it can attract attention and capital when long-term returns are strong and the manager has a distinctive brand.
Pershing Square’s strategy makes sense for future growth if three conditions hold. First, its flagship investment performance needs to remain compelling enough to attract and retain assets. Second, the firm needs to translate its reputation into durable fee-paying capital rather than mainly market-driven fluctuations in portfolio value. Third, cost growth must become more controlled, because recent expense expansion has outweighed revenue growth.
A meaningful catalyst is the platform’s ability to launch additional permanent or semi-permanent capital vehicles. For firms like Pershing Square, locked-up capital is valuable because it reduces redemption risk and gives management more flexibility to hold concentrated positions over many years. Another catalyst is any successful realization of value in core holdings through operational improvement, asset sales, restructurings, or re-ratings in the underlying portfolio companies.
Recent company communications and filings also matter because Pershing Square has been broadening its corporate structure and public-market presence, which can increase visibility, access to capital, and strategic flexibility. For a business built around a branded investment franchise, greater permanence of capital and a larger public profile can become important growth enablers if execution is disciplined.
Risks
This article is for informational purposes only and does not constitute financial advice. Some content is AI-generated. See Disclaimer


