Stock Analysis · Privia Health Group Inc (PRVA)
Overview
Privia Health Group is a healthcare services and technology company that works with physician practices, health systems, and health plans. Its core role is to help doctors move from a traditional fee-for-service model toward value-based care, where providers are rewarded more for outcomes, coordination, and cost control. In practice, Privia offers an operating platform that combines administrative support, technology, payer contracting, and population health tools so medical groups can stay independent while gaining some of the scale advantages of larger organizations.
The business is built around a network model. Privia partners with medical groups and health systems in multiple states, supports their day-to-day operations, and helps them manage patient populations under both fee-for-service and value-based arrangements. That makes it part healthcare enablement business, part care-management platform, and part revenue-cycle and practice-operations partner.
Its revenue mix is concentrated in two major streams disclosed in company filings.
- Fee-for-service patient care delivered revenue: approximately 89% to 91% of total revenue in recent years. This includes reimbursements tied to medical services delivered by Privia-participating providers, where the company records the associated patient care revenue and the related provider costs.
- Practice management and value-based care revenue: approximately 9% to 11% of total revenue in recent years. This includes administrative and management fees, shared savings, care management economics, and other amounts tied to helping providers improve quality and cost performance.
That revenue split can make the company look lower margin than a software business, because a large part of reported sales passes through the care delivery model. The more important lens is whether Privia keeps expanding provider participation, attributed lives, and value-based care penetration while gradually improving profit dollars.
Financially, the company has scaled rapidly over the last several years. Revenue moved from just under $1.0 billion in 2021 to a little above $2.1 billion in 2025, while operating income turned positive after earlier losses. Costs of revenue still represent the large majority of sales, which is normal for this model, but overhead as a share of revenue has improved meaningfully from the post-IPO period.
The multi-year picture shows a business that has grown much faster than overhead. Gross profit has expanded steadily, and selling and administrative costs have become more efficient relative to revenue, helping the company move from heavy losses in 2021 to modest profitability more recently.
Key Figures
| Metric | Value | Sector ⓘ |
|---|---|---|
| Date | Oct 24, 2026 | |
| Context | ||
| Sector | Healthcare | |
| Industry | Health Information Services | |
| Market Cap ⓘ | $2.87B | |
| Beta ⓘ | 0.80 | |
Value (Cheapness) | ||
| P/E Ratio ⓘ | 107.00 | 25.42 |
| P/B Ratio ⓘ | 0.00 | 3.08 |
| FCF Yield ⓘ | -1.68% | 3.12% |
| Dividend Yield ⓘ | N/A | 1.85% |
| EBIT / EV ⓘ | 2.76% | 0.56% |
| PEG ⓘ | N/A | |
Growth (Business expansion) | ||
| Revenue Growth ⓘ | 21.40% | 7.50% |
| RPS Growth (5Y CAGR) ⓘ | 16.44% | 8.60% |
| EPS Growth (5Y CAGR) ⓘ | -16.88% | -17.73% |
| BVPS Growth (5Y CAGR) ⓘ | 9.10% | 3.72% |
| Margin Growth (5Y Trend) ⓘ | 24.57% | -0.57% |
| FCF Growth (5Y CAGR) ⓘ | 31.34% | 0.96% |
| DPS Growth (5Y CAGR) ⓘ | N/A | 6.69% |
Quality (Business durability) | ||
| ROIC (Latest) ⓘ | 4.54% | 3.17% |
| ROA (Latest) ⓘ | 0.00% | 2.98% |
| ROIC (5Y Median) ⓘ | 2.85% | 4.56% |
| ROA (5Y Median) ⓘ | 1.35% | 1.87% |
| Net Debt / EBIT (Latest) ⓘ | -7,191.16 | 1.34 |
| Net Debt / EBIT (5Y Median) ⓘ | -13.14 | 1.86 |
| Net Debt / EBITDA (Latest) ⓘ | -5,918.89 | 1.00 |
| Net Debt / Assets ⓘ | -27.10% | 5.06% |
| EBITDA / Interest ⓘ | N/A | 9.55 |
| Operating Margin (Latest) ⓘ | 2.38% | 9.25% |
| Operating Margin (5Y Median) ⓘ | 1.61% | 7.33% |
| Debt to Equity (Latest) ⓘ | 1.12% | 26.68% |
| Profit Margin (Latest) ⓘ | 1.19% | 3.34% |
| Free Cash Flow (Latest) ⓘ | -$48.24M | |
Momentum (Price trend) | ||
| 3Y Return ⓘ | +2.58% | +51.61% |
| 12M Return (excl. last month) ⓘ | -15.02% | +19.90% |
| 6M Return ⓘ | -4.09% | +10.10% |
| Price vs. 200-Day MA ⓘ | +0.78% | +6.44% |
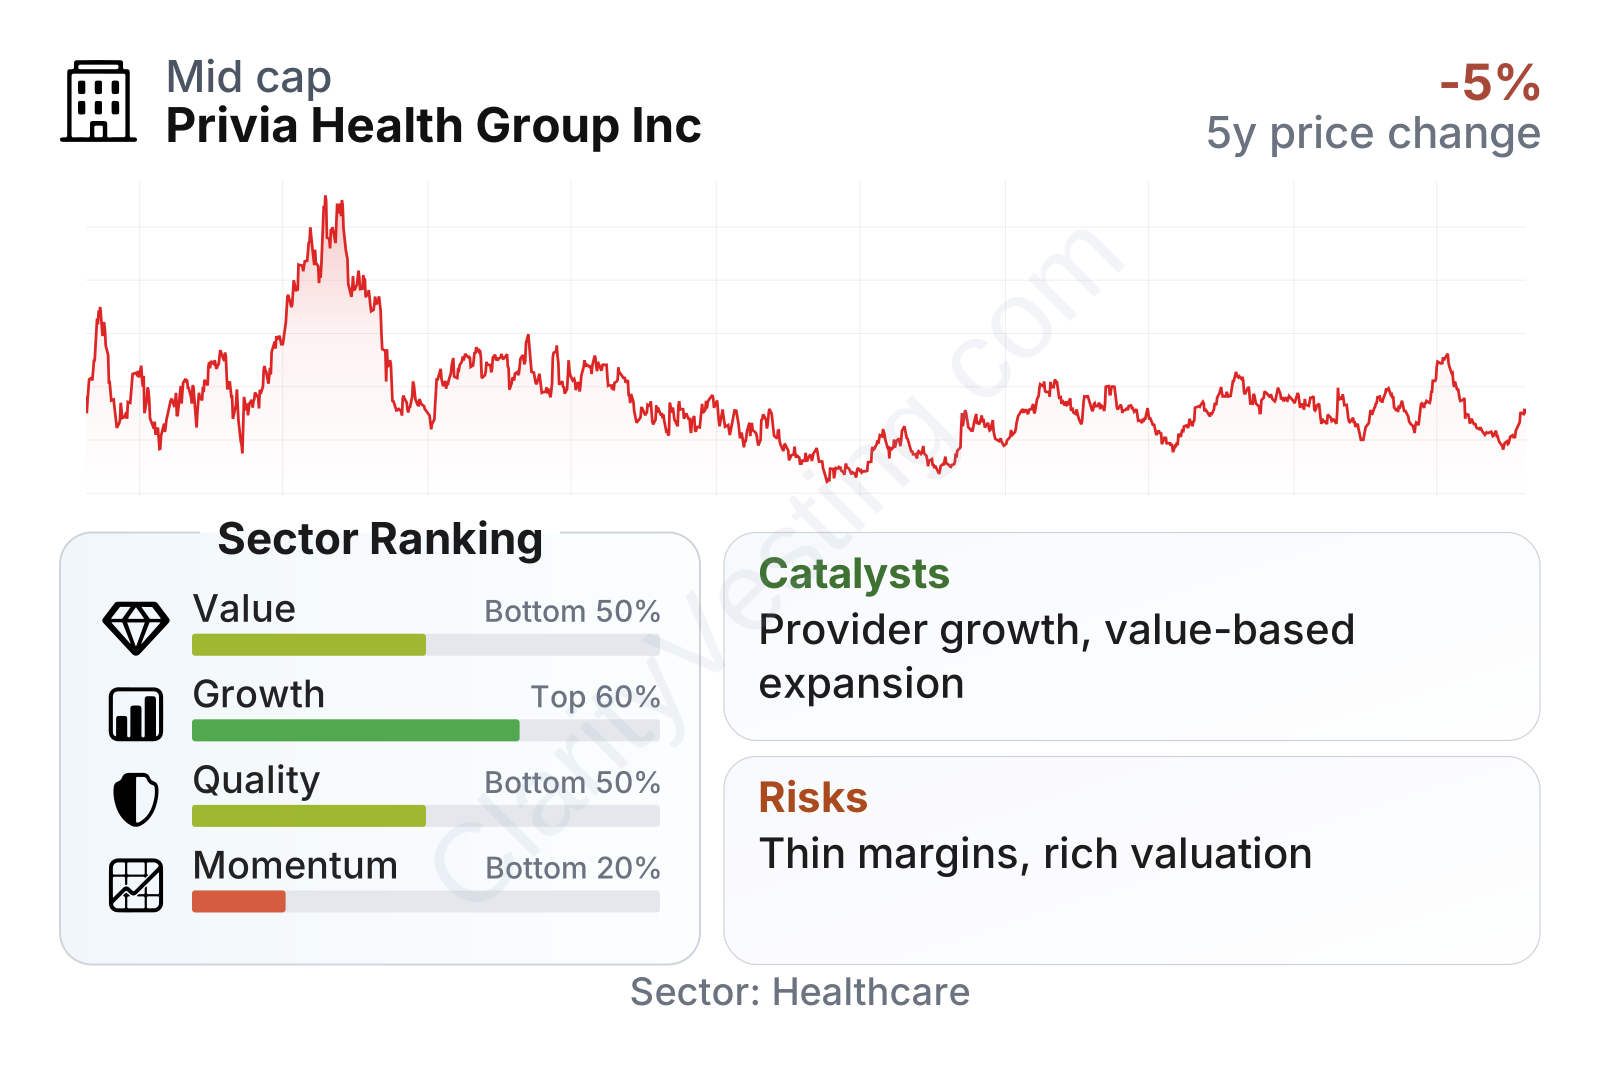
Privia sits in the mid-cap range, with a stock that has been more stable than the broader market on a volatility basis. The overall factor picture is mixed: growth metrics are stronger than much of the healthcare sector, but value, quality, and market momentum look weaker. The main reason is that revenue has been rising at a healthy pace while margins remain thin and the earnings multiple stays elevated. Balance-sheet risk is low, however, with very little leverage compared with sector norms.
Growth
Privia operates in an area of healthcare that still has structural room to expand. U.S. healthcare spending remains high, physician practices face growing administrative burdens, and payers and government programs continue pushing toward value-based reimbursement. That backdrop supports demand for platforms that help doctors remain independent while handling contracting, analytics, compliance, and care coordination. In that context, Privia is positioned in a growing segment rather than a mature niche.
The company’s strategy is fairly easy to understand. It adds providers and medical groups, enters new geographies, deepens relationships with health systems, and increases the number of patients managed under value-based arrangements. This approach makes sense because scale matters: a larger provider base improves payer relevance, data advantages, and the economic value of care management infrastructure. It also creates room for margin expansion if corporate costs grow more slowly than the network.
Revenue growth has not been perfectly smooth, but the broader pattern remains favorable. Growth ran very high in 2022 and 2023, slowed sharply in 2024, then reaccelerated in 2025 and stayed above 20% in the first half of 2026. That rebound is important because it suggests the 2024 slowdown did not break the longer-term expansion trend.
Cash generation has also improved materially over time. Free cash flow was solidly positive through the most recent annual progression shown and climbed from roughly $50 million levels to well above $100 million before the latest table snapshot turned negative on a trailing basis. That combination suggests the business can produce meaningful cash, but working-capital timing or recent investments can create short-term noise. For a company in this type of healthcare model, sustained cash conversion matters as much as accounting profit.
A notable catalyst is continued adoption of value-based care by physicians, Medicare-focused groups, commercial payers, and health systems. Another is geographic expansion through new market launches and partnerships. Privia has regularly highlighted provider growth, implemented providers, and attributed lives as core operating drivers, and those indicators matter because they can feed future revenue before full profit shows up.
Recent company updates have also pointed to continued market expansion and network growth, which is significant because Privia’s model becomes more powerful as density builds in each region. If the company keeps increasing lives under management while preserving its low-debt profile, that strengthens the long-term operating case.
Risks
This article is for informational purposes only and does not constitute financial advice. Some content is AI-generated. See Disclaimer


