Stock Analysis · Park National Corporation (PRK)
Overview
Park National Corporation is a regional banking company based in Ohio. Through Park National Bank and its community banking offices, it provides traditional banking services to individuals, businesses, and local institutions. Its model is straightforward: gather deposits, make loans, earn net interest income from the spread between the two, and add fee income from services such as wealth management, service charges, and card-related activity.
The company operates in community banking, a part of financial services that tends to be slower-moving than fast-growth technology sectors but can produce durable results when credit quality is sound and customer relationships are sticky. Park National’s footprint is concentrated in Ohio and neighboring markets, which gives it local market knowledge but also ties performance closely to regional economic conditions.
Based on recent annual reporting, Park National’s revenue mix is still dominated by interest-related banking income, with noninterest income playing a secondary role. Exact line-by-line shares move with rates and loan demand, but the business can be summarized this way:
- Net interest income: approximately 75% to 85% of total revenue in a typical recent year. This includes interest earned on commercial loans, residential real estate loans, consumer loans, and investment securities, minus interest paid on deposits and borrowings.
- Wealth management and trust income: approximately 5% to 10%. This comes from fiduciary, asset management, estate, and related advisory services.
- Service charges and deposit account fees: approximately 3% to 6%. This includes overdraft-related fees, account service charges, and treasury management fees.
- Card, interchange, and other customer fees: approximately 2% to 5%. This includes debit card activity and other transaction-related fees.
- Mortgage banking, securities gains, and other noninterest income: approximately 2% to 6%. These items can vary more from year to year.
Over the last several years, total revenue has trended upward, and net income recovered strongly after the rate-pressure period that affected many regional banks. Operating expenses rose much more slowly than revenue, which helped margins improve. That pattern matters for a bank like Park National because long-term value creation often comes from disciplined underwriting and expense control rather than rapid expansion.
The business mix also shows a favorable recent pattern: revenue and profit have increased meaningfully since 2023, while overhead growth has been comparatively moderate. That suggests the company has recently captured better earning power from its balance sheet without needing equally large cost increases.
Key Figures
| Metric | Value | Sector ⓘ |
|---|---|---|
| Date | Oct 17, 2026 | |
| Context | ||
| Sector | Financial Services | |
| Industry | Banks - Regional | |
| Market Cap ⓘ | $3.17B | |
| Beta ⓘ | 0.71 | |
Value (Cheapness) | ||
| P/E Ratio ⓘ | 15.70 | 12.26 |
| P/B Ratio ⓘ | 1.85 | 1.23 |
| FCF Yield ⓘ | 5.80% | 10.40% |
| Dividend Yield ⓘ | 2.47% | 3.02% |
| EBIT / EV ⓘ | 4.03% | 8.14% |
| PEG ⓘ | 3.47 | |
Growth (Business expansion) | ||
| Revenue Growth ⓘ | 25.70% | 9.35% |
| RPS Growth (5Y CAGR) ⓘ | 9.11% | 12.19% |
| EPS Growth (5Y CAGR) ⓘ | -6.44% | -9.53% |
| BVPS Growth (5Y CAGR) ⓘ | 5.44% | 4.99% |
| Margin Growth (5Y Trend) ⓘ | -6.25% | -3.86% |
| FCF Growth (5Y CAGR) ⓘ | 7.59% | 4.81% |
| DPS Growth (5Y CAGR) ⓘ | 5.27% | 8.79% |
Quality (Business durability) | ||
| ROIC (Latest) ⓘ | N/A | 9.49% |
| ROE (Latest) ⓘ | 12.47% | 13.90% |
| ROA (Latest) ⓘ | 1.69% | 1.55% |
| ROIC (5Y Median) ⓘ | 10.14% | 7.86% |
| ROE (5Y Median) ⓘ | 13.61% | 12.17% |
| ROA (5Y Median) ⓘ | 1.54% | 1.30% |
| Net Debt / EBIT (Latest) ⓘ | 0.10 | 0.96 |
| Net Debt / EBIT (5Y Median) ⓘ | 1.18 | 0.73 |
| Net Debt / EBITDA (Latest) ⓘ | 0.09 | 0.92 |
| Operating Margin (Latest) ⓘ | 18.24% | 22.30% |
| Operating Margin (5Y Median) ⓘ | 33.31% | 24.63% |
| Debt to Equity (Latest) ⓘ | 9.06% | 58.56% |
| Profit Margin (Latest) ⓘ | 31.25% | 26.57% |
| Free Cash Flow (Latest) ⓘ | $183.90M | |
Momentum (Price trend) | ||
| 3Y Return ⓘ | +102.68% | +88.33% |
| 12M Return (excl. last month) ⓘ | +15.99% | +19.38% |
| 6M Return ⓘ | +4.98% | +4.75% |
| Price vs. 200-Day MA ⓘ | +1.67% | +3.50% |
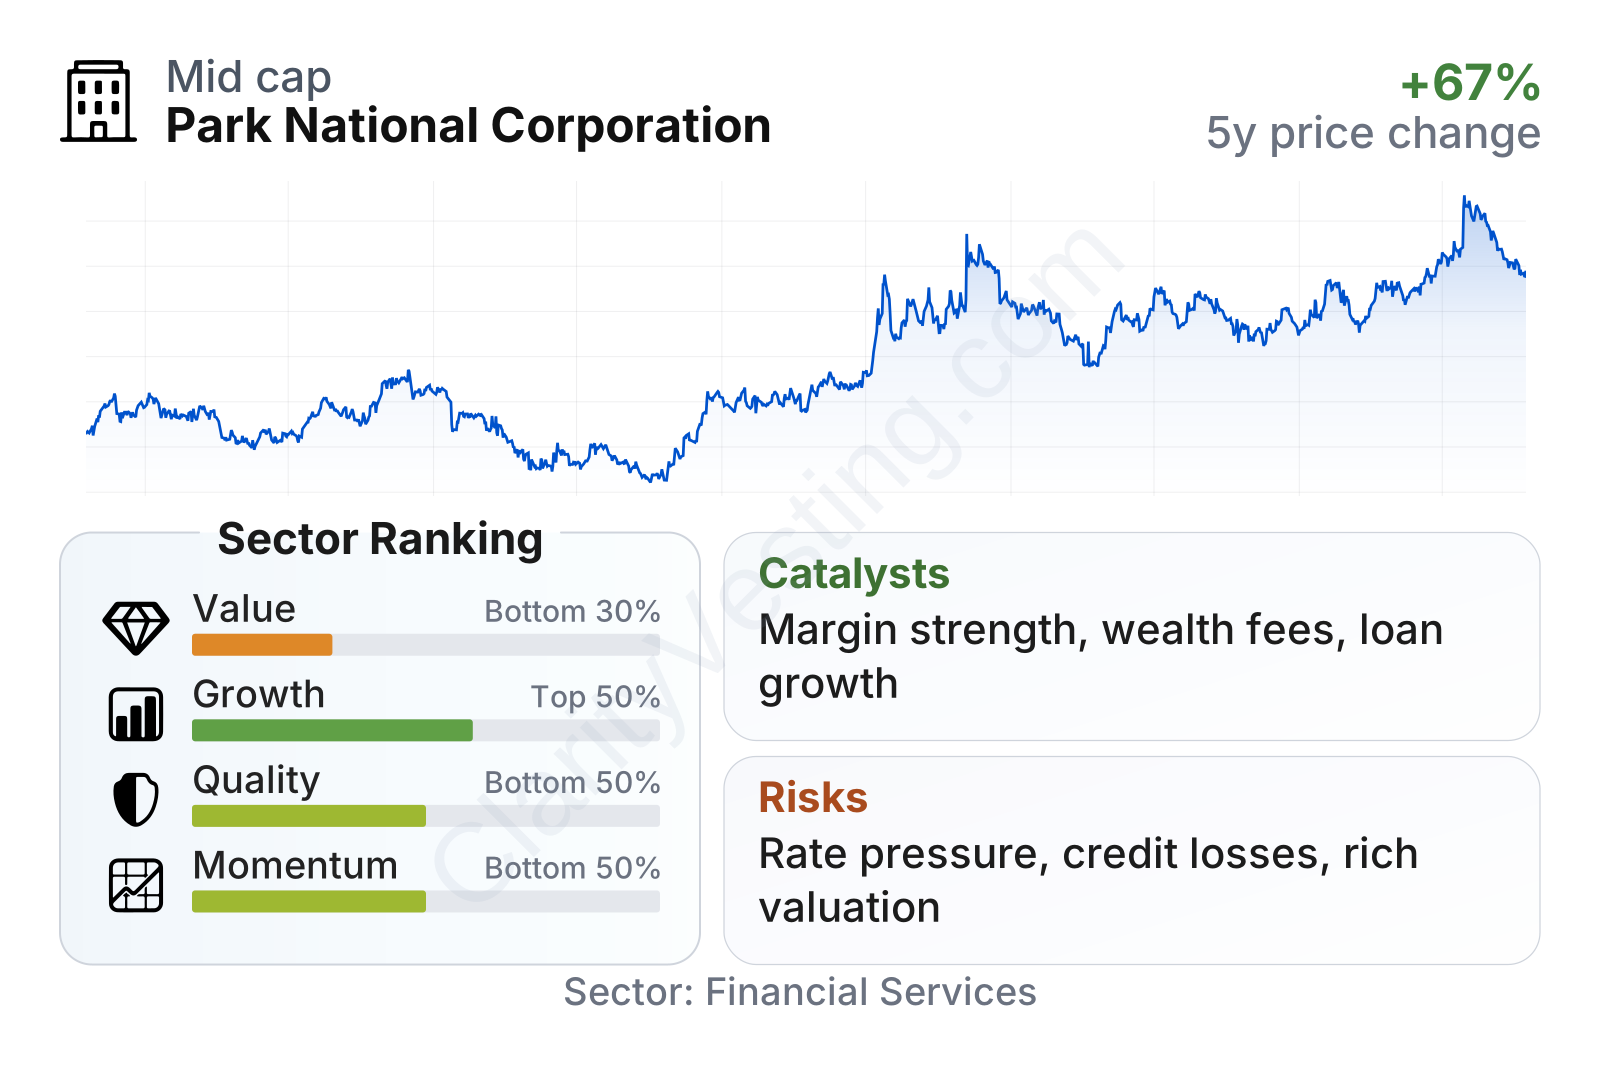
Park National is a mid-sized regional bank with a relatively low share-price volatility profile, reflected in a beta well below 1. On current metrics, it does not look cheap relative to its sector. The stock trades above the regional bank median on both earnings and book value multiples, while the dividend yield is slightly below the sector median. At the same time, operating profitability is notably strong, leverage measures look conservative, and recent revenue growth has been better than many peers. In short, the market appears to be assigning a premium for stability, profitability, and balance-sheet quality rather than for high long-term growth.
The share-price history also reflects that pattern. Park National went through the regional bank selloff in 2023, then recovered strongly through 2024, 2025, and into 2026. That rebound indicates that confidence in earnings power and balance-sheet resilience improved materially after the stress period for the industry.
Growth
Regional banking is not usually a high-growth industry, but it can still be an attractive one when a bank has a disciplined credit culture, a sticky deposit base, and room to deepen relationships in its local markets. Park National operates in mature markets, so its long-term growth path is more likely to come from steady loan growth, deposit gathering, wealth management expansion, and selective acquisitions rather than from dramatic geographic disruption.
Its strategy appears sensible for that environment. Park National has historically focused on community banking, relationship lending, and measured capital deployment. For a long-term view, that can be more durable than aggressive loan expansion. The latest growth indicators are mixed but constructive: recent year-over-year revenue growth has been strong versus the sector median, free cash flow has compounded well over five years, and book value per share has expanded at roughly a mid-single-digit annual pace. Revenue per share growth over five years is positive, though not exceptional relative to peers, and dividend growth has been slower than the sector median.
Earnings per share show an important recent improvement. After softening in 2022 and 2023, EPS recovered in 2024 and then moved higher in 2025. That suggests the company benefited from a better spread environment, stronger revenue capture, or both. For a bank, that kind of rebound matters because it shows that earnings pressure during the tougher rate period was not permanent.
Book value per share has also moved steadily upward after a dip in 2022. That is a useful sign for banks because book value growth often reflects retained earnings, capital strength, and the ability to build shareholder value without relying only on market sentiment. Park National’s five-year book value compounding is close to the sector median, which supports the view of a solid rather than exceptional growth profile.
A meaningful catalyst is the possibility of sustained net interest income support if loan yields remain favorable relative to deposit costs. Another is the company’s ability to keep expenses under control while expanding fee-based businesses such as wealth management. In a fragmented regional banking industry, smaller acquisitions or branch-level market share gains can also create incremental opportunity if management remains selective.
Recent results through 2025 and 2026 market performance point to a company that has emerged from the regional bank stress period in better shape than many peers. That does not transform Park National into a high-growth name, but it does improve the case for durable compounding if operating conditions remain stable.
Risks
This article is for informational purposes only and does not constitute financial advice. Some content is AI-generated. See Disclaimer


