Stock Analysis · Primoris Services Corporation (PRIM)
Overview
Primoris Services Corporation is a U.S. infrastructure contractor that builds, maintains, and upgrades essential physical assets. Its work spans electric utility systems, renewable energy facilities, pipelines, industrial plants, communications infrastructure, and transportation-related projects. In simple terms, the company is paid to deliver large construction and maintenance jobs that help keep power, energy, and industrial networks operating.
The business is organized mainly around two reporting segments in recent company filings: Utilities and Energy. Utilities includes electric transmission and distribution, communications, and gas utility work. Energy includes renewable power construction, industrial and process facility services, and certain civil and pipeline-related activities. This makes Primoris less like a manufacturer with recurring product sales and more like a project-driven operator whose revenue depends on contract awards, backlog conversion, execution quality, and customer spending cycles.
Based on the latest annual reporting structure, revenue is primarily generated from the following sources:
- Utilities: approximately 55% to 60% of revenue. This includes electric utility services, grid modernization, distribution and transmission work, and communications infrastructure.
- Energy: approximately 40% to 45% of revenue. This includes renewable energy construction, industrial services, pipeline activity, and broader energy-related infrastructure projects.
That mix matters because utility work tends to be supported by ongoing grid investment, while energy work can offer stronger upside when renewable and industrial spending is active but may also be more cyclical from year to year.
The business has expanded notably in recent years, with revenue rising from roughly $3.5 billion in 2021 to about $7.6 billion in 2025. Over that period, gross profit and operating income also moved higher, and interest expense declined sharply in 2025, helping net income improve. The broad pattern suggests a company that has grown scale meaningfully, although profitability still remains relatively thin for a construction-focused operator.
Key Figures
| Metric | Value | Sector ⓘ |
|---|---|---|
| Date | Oct 24, 2026 | |
| Context | ||
| Sector | Industrials | |
| Industry | Engineering & Construction | |
| Market Cap ⓘ | $3.91B | |
| Beta ⓘ | 1.44 | |
Value (Cheapness) | ||
| P/E Ratio ⓘ | 29.09 | 22.29 |
| P/B Ratio ⓘ | 2.44 | 1.98 |
| FCF Yield ⓘ | 2.25% | 6.26% |
| Dividend Yield ⓘ | 0.43% | 1.92% |
| EBIT / EV ⓘ | 4.04% | 4.83% |
| PEG ⓘ | 1.22 | |
Growth (Business expansion) | ||
| Revenue Growth ⓘ | -10.70% | 9.30% |
| RPS Growth (5Y CAGR) ⓘ | 20.39% | 7.76% |
| EPS Growth (5Y CAGR) ⓘ | -42.97% | -13.17% |
| BVPS Growth (5Y CAGR) ⓘ | 13.29% | 6.13% |
| Margin Growth (5Y Trend) ⓘ | 0.58% | 0.74% |
| FCF Growth (5Y CAGR) ⓘ | N/A | 10.79% |
| DPS Growth (5Y CAGR) ⓘ | 7.50% | 9.41% |
Quality (Business durability) | ||
| ROIC (Latest) ⓘ | 6.72% | 10.75% |
| ROA (Latest) ⓘ | 3.01% | 5.41% |
| ROIC (5Y Median) ⓘ | 9.68% | 9.37% |
| ROA (5Y Median) ⓘ | 4.51% | 4.95% |
| Net Debt / EBIT (Latest) ⓘ | 4.38 | 2.04 |
| Net Debt / EBIT (5Y Median) ⓘ | 3.64 | 2.27 |
| Net Debt / EBITDA (Latest) ⓘ | 2.91 | 1.39 |
| Net Debt / Assets ⓘ | 19.26% | 19.27% |
| EBITDA / Interest ⓘ | 10.73 | 9.58 |
| Operating Margin (Latest) ⓘ | 2.80% | 10.49% |
| Operating Margin (5Y Median) ⓘ | 4.87% | 10.30% |
| Debt to Equity (Latest) ⓘ | 69.20% | 64.82% |
| Profit Margin (Latest) ⓘ | 1.92% | 6.67% |
| Free Cash Flow (Latest) ⓘ | $87.98M | |
Momentum (Price trend) | ||
| 3Y Return ⓘ | +143.53% | +67.77% |
| 12M Return (excl. last month) ⓘ | -40.14% | +12.05% |
| 6M Return ⓘ | -55.79% | 0.00% |
| Price vs. 200-Day MA ⓘ | -37.13% | +0.67% |
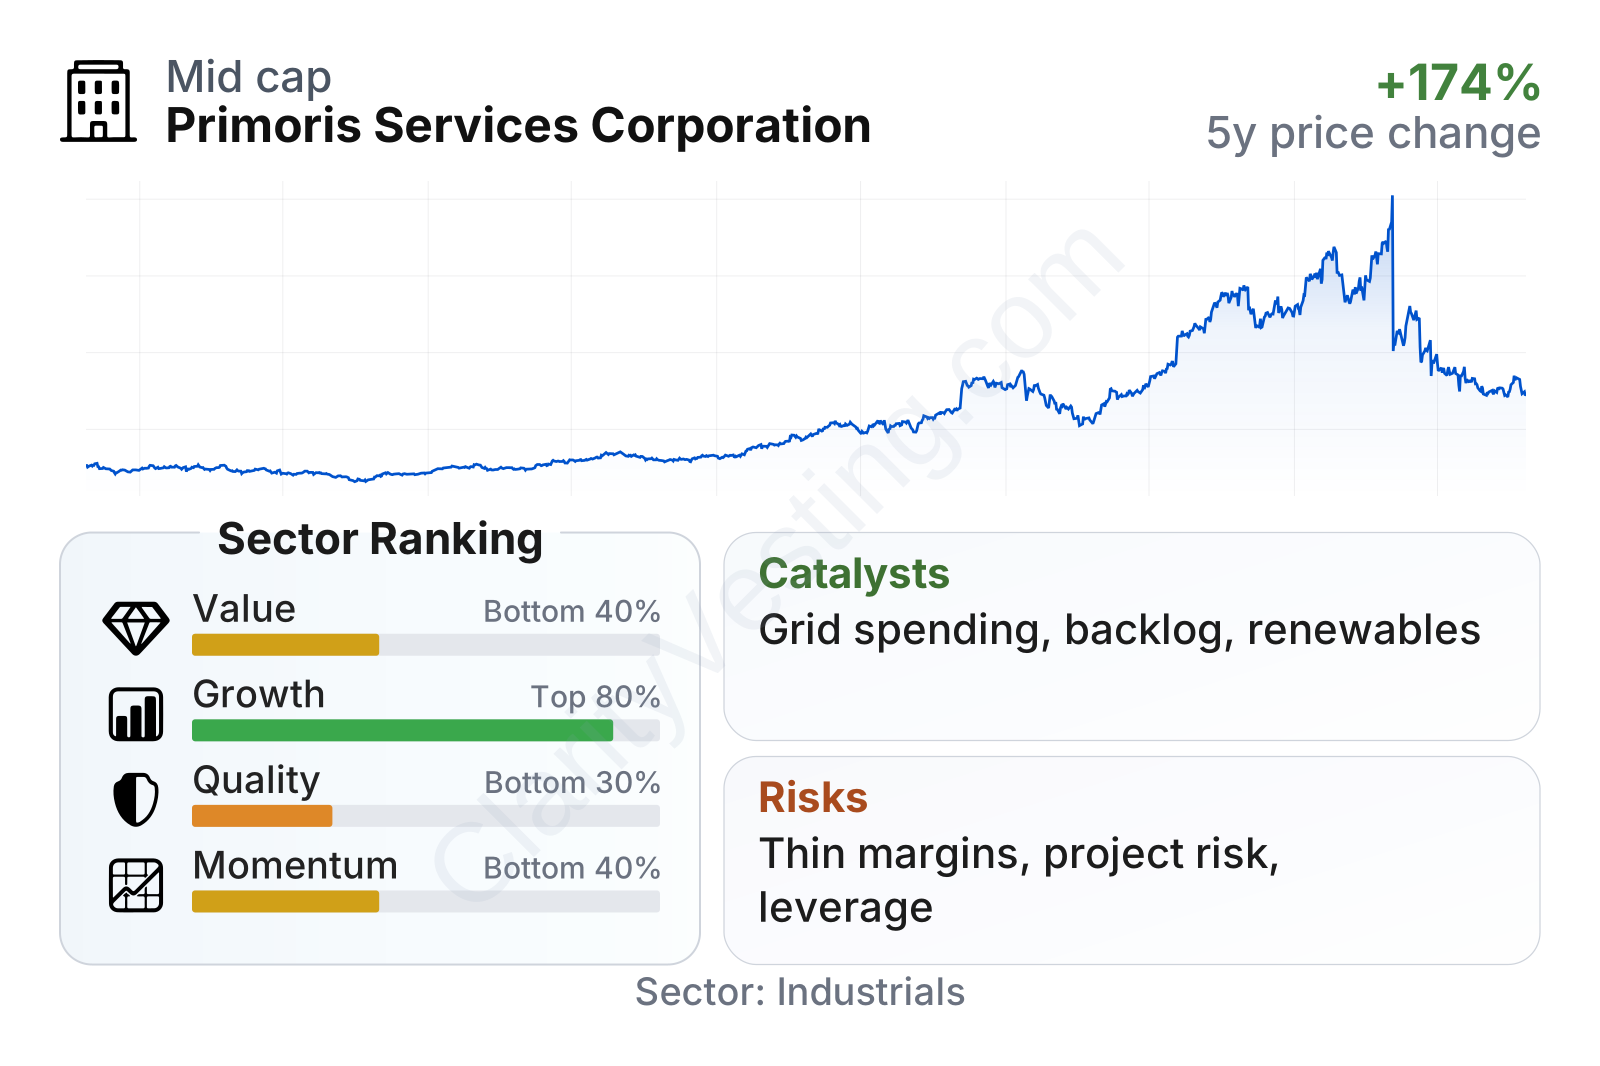
Primoris is a mid-sized company in the industrials sector, with a stock that has shown above-average volatility. The share price had a very strong multi-year run before a sharp pullback in 2026, which helps explain why momentum now looks weak even though the longer-term stock performance remains strong. The factor table points to a mixed profile: growth characteristics are better than many peers over a five-year view, but value, quality, and recent momentum rank less favorably. In particular, the business has grown revenue per share and book value per share at a healthy pace, while returns on capital and free cash flow yield remain less impressive than the sector median.
Growth
Primoris operates in parts of the market that still have durable long-term demand. Electric grid upgrades, power reliability spending, renewable generation buildout, data and communications infrastructure, and industrial facility work all support the need for engineering and construction services. In the United States, utility capital spending and grid hardening are especially important themes because aging infrastructure, electrification, and rising power demand require continuous investment.
The company’s strategy is broadly aligned with those trends. Primoris has positioned itself around utility and energy infrastructure rather than general building construction, which gives it exposure to markets with structural spending needs. Its utility operations are particularly important because electric transmission and distribution programs often run for multiple years, creating more visibility than one-off private construction projects. The energy segment also provides access to renewables and industrial opportunities that can accelerate growth when demand is favorable.
Recent growth has not been perfectly smooth. Revenue growth was very strong through much of 2022, 2023, 2024, and parts of 2025, but it turned negative in early 2026. That slowdown does not automatically mean the long-term thesis has changed, but it does show how project timing, customer decisions, and comparisons against strong prior periods can create abrupt swings in reported growth.
Cash generation also deserves attention. Free cash flow improved dramatically from negative levels in earlier periods to a strong positive peak in 2025, then moderated again in 2026. For a contractor, this kind of movement is common because working capital can fluctuate heavily based on billing schedules, project ramp-ups, and customer payments. Even so, the shift from negative to positive cash flow over the last few years supports the view that scale and execution improved before the more recent cooling.
A meaningful catalyst is the continued need for electric infrastructure expansion in the U.S. Public policy support for grid resiliency, renewable interconnection, and domestic energy investment can translate into more contract opportunities. Company communications in recent periods have also highlighted backlog strength and activity in utility and renewable end markets, which is important because backlog is often the clearest early signal of future revenue for an engineering and construction firm.
Risks
This article is for informational purposes only and does not constitute financial advice. Some content is AI-generated. See Disclaimer


