Stock Analysis · PPL Corporation (PPL)
Overview
PPL Corporation is a regulated electric and natural gas utility. In simple terms, it owns energy networks that deliver electricity and gas to homes and businesses, and it earns most of its money through rates approved by state utility regulators. After selling its U.K. utility business and completing the acquisition of Rhode Island Energy in recent years, PPL is now focused on U.S. regulated operations, mainly in Pennsylvania, Kentucky, Rhode Island, and Virginia.
That business mix matters for long-term analysis because regulated utilities usually have steadier demand than most industries. People keep using electricity and gas in weak economies, and utilities can often recover approved investments over time through customer rates, although not always immediately.
Based on recent annual reporting, PPL’s revenue is primarily split across these operating areas:
- Kentucky Regulated: approximately 39% of total revenue. This includes Louisville Gas and Electric and Kentucky Utilities, which provide regulated electricity and natural gas service.
- Pennsylvania Regulated: approximately 29% of total revenue. This is mainly electricity delivery through PPL Electric Utilities.
- Rhode Island Regulated: approximately 27% of total revenue. This includes electricity and natural gas delivery through Rhode Island Energy.
- Virginia Regulated: approximately 5% of total revenue. This is a smaller regulated solar and generation-related platform.
The broad takeaway is that PPL is not dependent on one single market, but it is still a pure regulated utility rather than a fast-changing competitive power producer. That generally supports earnings visibility, while also limiting upside to what regulators allow.
Over the last several years, revenue, operating income, and net income have all moved higher overall. The most notable improvement is that profitability recovered strongly after the 2021 loss and continued to expand through 2025, even as interest expense also climbed. That pattern is typical of a utility investing heavily in its system: larger asset base, improving regulated earnings, but also higher financing costs.
Key Figures
| Metric | Value | Sector ⓘ |
|---|---|---|
| Date | Oct 03, 2026 | |
| Context | ||
| Sector | Utilities | |
| Industry | Utilities - Regulated Electric | |
| Market Cap ⓘ | $24.52B | |
| Beta ⓘ | 0.58 | |
Value (Cheapness) | ||
| P/E Ratio ⓘ | 19.28 | 16.80 |
| P/B Ratio ⓘ | 1.66 | 1.48 |
| FCF Yield ⓘ | 1.42% | 0.64% |
| Dividend Yield ⓘ | 3.47% | 3.91% |
| EBIT / EV ⓘ | 5.53% | 5.01% |
| PEG ⓘ | 1.18 | |
Growth (Business expansion) | ||
| Revenue Growth ⓘ | 4.20% | 6.00% |
| RPS Growth (5Y CAGR) ⓘ | 12.62% | 4.14% |
| EPS Growth (5Y CAGR) ⓘ | -9.58% | -11.39% |
| BVPS Growth (5Y CAGR) ⓘ | 2.77% | 4.29% |
| Margin Growth (5Y Trend) ⓘ | 0.33% | 3.55% |
| FCF Growth (5Y CAGR) ⓘ | N/A | -9.10% |
| DPS Growth (5Y CAGR) ⓘ | -10.60% | 4.51% |
Quality (Business durability) | ||
| ROIC (Latest) ⓘ | 5.70% | 6.53% |
| ROA (Latest) ⓘ | 2.81% | 3.19% |
| ROIC (5Y Median) ⓘ | 4.42% | 6.12% |
| ROA (5Y Median) ⓘ | 2.13% | 2.76% |
| Net Debt / EBIT (Latest) ⓘ | 7.98 | 7.15 |
| Net Debt / EBIT (5Y Median) ⓘ | 8.90 | 7.24 |
| Net Debt / EBITDA (Latest) ⓘ | 4.98 | 4.40 |
| Net Debt / Assets ⓘ | 42.16% | 39.16% |
| EBITDA / Interest ⓘ | 4.49 | 4.41 |
| Operating Margin (Latest) ⓘ | 26.02% | 20.93% |
| Operating Margin (5Y Median) ⓘ | 21.91% | 20.18% |
| Debt to Equity (Latest) ⓘ | 131.96% | 140.88% |
| Profit Margin (Latest) ⓘ | 13.47% | 11.32% |
| Free Cash Flow (Latest) ⓘ | $347.00M | |
Momentum (Price trend) | ||
| 3Y Return ⓘ | +54.19% | +48.75% |
| 12M Return (excl. last month) ⓘ | -3.45% | +11.24% |
| 6M Return ⓘ | -12.49% | -3.69% |
| Price vs. 200-Day MA ⓘ | -7.58% | -1.97% |
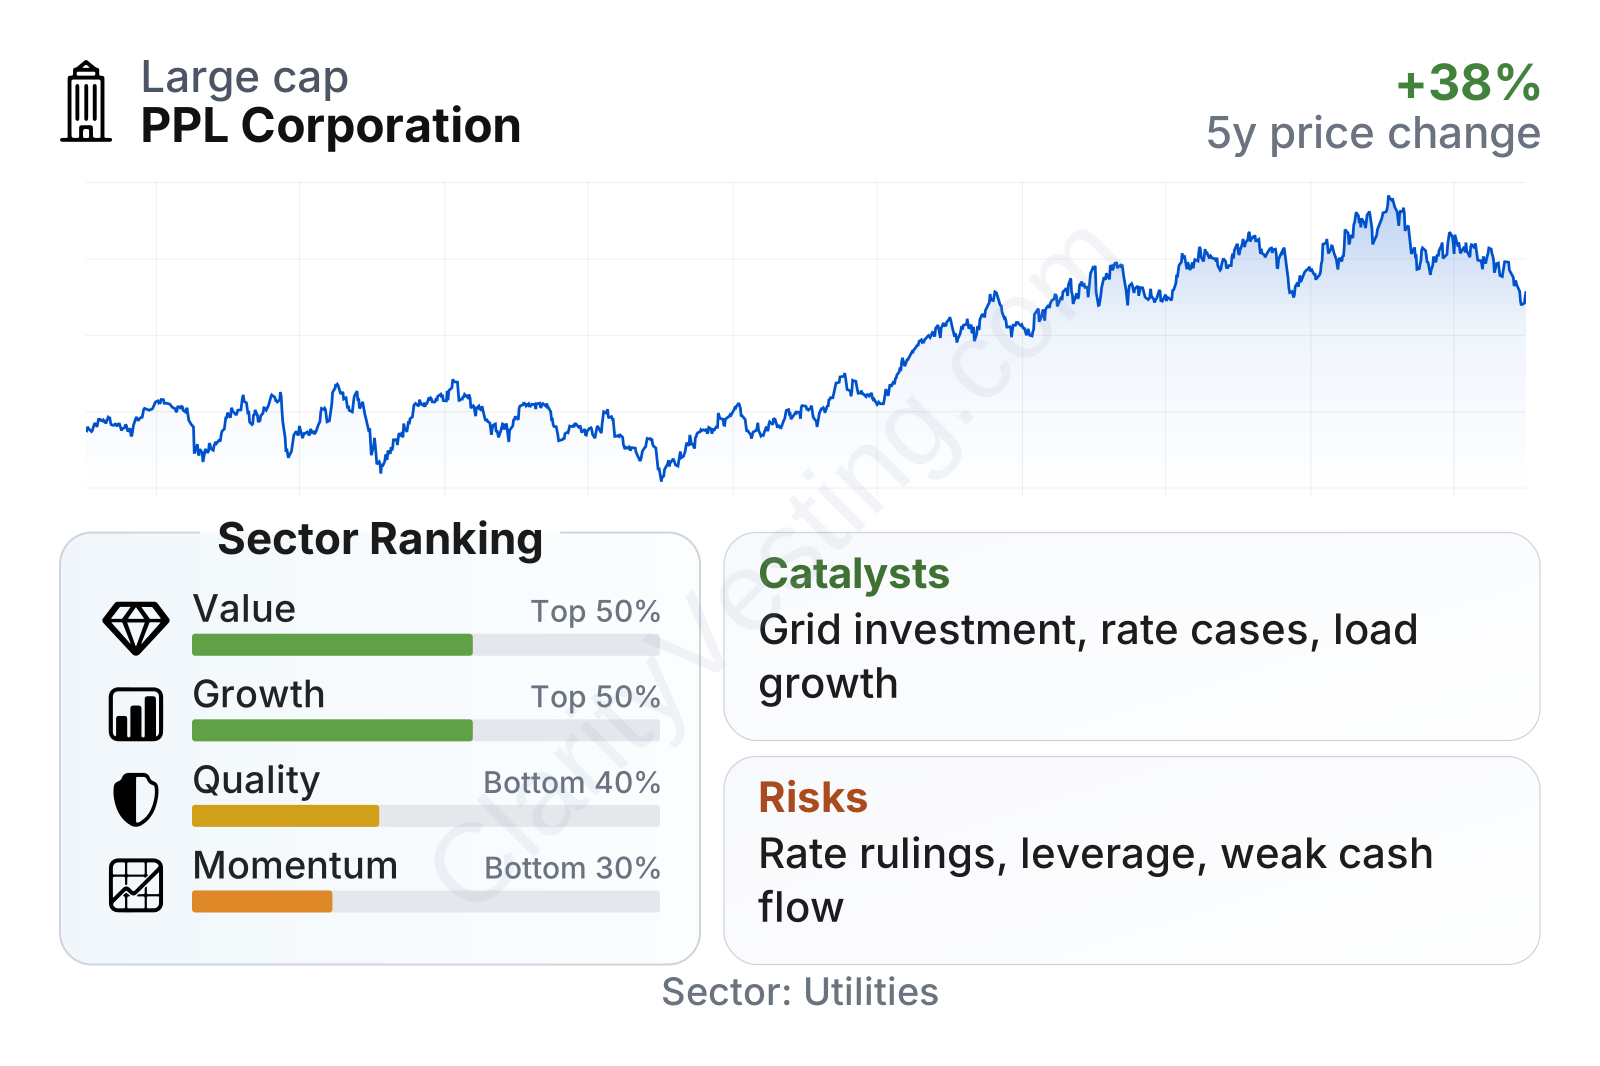
PPL is a large utility with relatively low share-price volatility, as shown by its beta well below 1. In the factor breakdown, it ranks in the top half of the utility sector for value and growth, but weaker on quality and especially momentum. That combination suggests a company with decent earnings and cash generation characteristics for the sector, but without the strongest balance-sheet or return profile, and with a stock that has recently lagged peers.
Its valuation is somewhat above the sector median on earnings and book value, while free cash flow yield looks stronger than the sector median. Growth is mixed: recent year-over-year revenue growth is modest, but five-year revenue per share growth is clearly stronger than the sector median. Quality is the more cautious area. Returns on capital and assets trail the median, and leverage remains meaningful, even if debt to equity is a bit better than the sector median. Profitability itself is not weak, however, with operating and profit margins currently above sector norms.
Growth
Utilities are not a high-growth sector in the usual sense, but they are in a favorable long-term investment cycle. Electricity demand is being supported by grid modernization, data center expansion, industrial reshoring, electrification, and resilience spending. For a company like PPL, growth mainly comes from putting more capital into regulated infrastructure and then earning an approved return on that larger asset base.
PPL’s strategy fits that model well. The company has been emphasizing a multi-year capital plan focused on transmission, distribution, grid reliability, and cleaner energy investments. This is a practical approach for a regulated utility because it does not depend on volatile commodity prices. Instead, it depends on executing projects, winning regulatory approvals, and keeping customer bills manageable enough for those plans to remain acceptable.
Revenue per share has trended upward materially over the last five years, which is a constructive sign for a utility. It suggests that the company’s asset base and customer-related revenue have been expanding faster than any dilution pressure. Even though annual revenue growth is not especially fast, the longer trend points to a business that has been getting bigger in a measured way.
One point that needs context is cash flow. Free cash flow has been volatile and recently negative on a trailing basis, which can look concerning at first glance. For utilities, that often reflects heavy capital spending rather than a weakening core business. The key question is whether those investments are feeding future regulated earnings. In PPL’s case, rising operating income and net income suggest the spending is supporting growth, but the company still needs continued access to debt and equity markets to fund that program efficiently.
Recent company updates have also highlighted ongoing infrastructure investment plans and regulatory milestones across its states. In a regulated utility, these are often the most important catalysts: rate cases, base rate resets, storm recovery mechanisms, transmission projects, and capital plans tied to reliability or cleaner generation. None of these usually transform the business overnight, but together they can steadily lift earnings over many years.
Risks
This article is for informational purposes only and does not constitute financial advice. Some content is AI-generated. See Disclaimer