Stock Analysis · Pilgrims Pride Corp (PPC)
Overview
Pilgrim’s Pride is one of the largest chicken producers in the world. The company processes, prepares, packages, and distributes fresh, frozen, and value-added chicken products, along with a smaller prepared-foods and pork business. Its products are sold to grocery retailers, restaurant chains, foodservice distributors, and industrial customers that use chicken as an ingredient in other food products. The business is geographically diversified, with major operations in the United States, Europe, and Mexico.
Revenue is mainly driven by chicken sales, but the mix is broader than a simple commodity meat business. Based on recent company reporting, the main sources of revenue are approximately:
- U.S. operations: about 60% to 65% — fresh chicken, case-ready products, prepared foods, retail-branded and private-label items, and sales to foodservice customers.
- Europe operations: about 20% to 25% — value-added poultry, prepared foods, and branded products sold across the U.K. and continental Europe.
- Mexico operations: about 10% to 15% — fresh and prepared chicken products sold into retail and foodservice channels.
- Feed, rendering, and other by-product revenue: low single-digit share — products such as animal feed ingredients and other processing by-products.
The company’s recent earnings profile shows an important feature of the business: sales have been fairly stable, while profitability has swung sharply with input costs and market pricing. After a weak period in 2021 and another uneven year in 2023, margins improved strongly in 2024 and stayed elevated in 2025, helped by better pricing and a much healthier spread between selling prices and production costs.
The visual breakdown highlights that the business keeps most of its revenue tied up in production costs, which is typical for protein processors. The notable change in the last two years is not explosive revenue growth, but a much better conversion of sales into operating profit and net income.
Key Figures
| Metric | Value | Sector ⓘ |
|---|---|---|
| Date | Oct 17, 2026 | |
| Context | ||
| Sector | Consumer Defensive | |
| Industry | Packaged Foods | |
| Market Cap ⓘ | $6.85B | |
| Beta ⓘ | 0.33 | |
Value (Cheapness) | ||
| P/E Ratio ⓘ | 12.62 | 17.88 |
| P/B Ratio ⓘ | 1.84 | 1.29 |
| FCF Yield ⓘ | 4.44% | 12.39% |
| Dividend Yield ⓘ | N/A | 2.85% |
| EBIT / EV ⓘ | 10.29% | 6.43% |
| PEG ⓘ | 0.49 | |
Growth (Business expansion) | ||
| Revenue Growth ⓘ | -2.80% | 4.10% |
| RPS Growth (5Y CAGR) ⓘ | 6.40% | 6.18% |
| EPS Growth (5Y CAGR) ⓘ | -24.64% | -13.59% |
| BVPS Growth (5Y CAGR) ⓘ | 9.99% | 3.20% |
| Margin Growth (5Y Trend) ⓘ | 7.38% | -0.15% |
| FCF Growth (5Y CAGR) ⓘ | N/A | 4.10% |
| DPS Growth (5Y CAGR) ⓘ | N/A | 6.79% |
Quality (Business durability) | ||
| ROIC (Latest) ⓘ | 9.76% | 12.34% |
| ROA (Latest) ⓘ | 5.46% | 6.30% |
| ROIC (5Y Median) ⓘ | 14.50% | 10.49% |
| ROA (5Y Median) ⓘ | 8.21% | 5.44% |
| Net Debt / EBIT (Latest) ⓘ | 2.77 | 1.96 |
| Net Debt / EBIT (5Y Median) ⓘ | 2.65 | 2.35 |
| Net Debt / EBITDA (Latest) ⓘ | 1.85 | 1.38 |
| Net Debt / Assets ⓘ | 26.46% | 21.51% |
| EBITDA / Interest ⓘ | 8.72 | 9.46 |
| Operating Margin (Latest) ⓘ | 5.19% | 8.87% |
| Operating Margin (5Y Median) ⓘ | 6.74% | 9.53% |
| Debt to Equity (Latest) ⓘ | 81.39% | 72.35% |
| Profit Margin (Latest) ⓘ | 2.96% | 5.40% |
| Free Cash Flow (Latest) ⓘ | $304.42M | |
Momentum (Price trend) | ||
| 3Y Return ⓘ | +41.55% | +20.92% |
| 12M Return (excl. last month) ⓘ | -30.69% | +2.13% |
| 6M Return ⓘ | -19.20% | +1.26% |
| Price vs. 200-Day MA ⓘ | -13.24% | +1.39% |
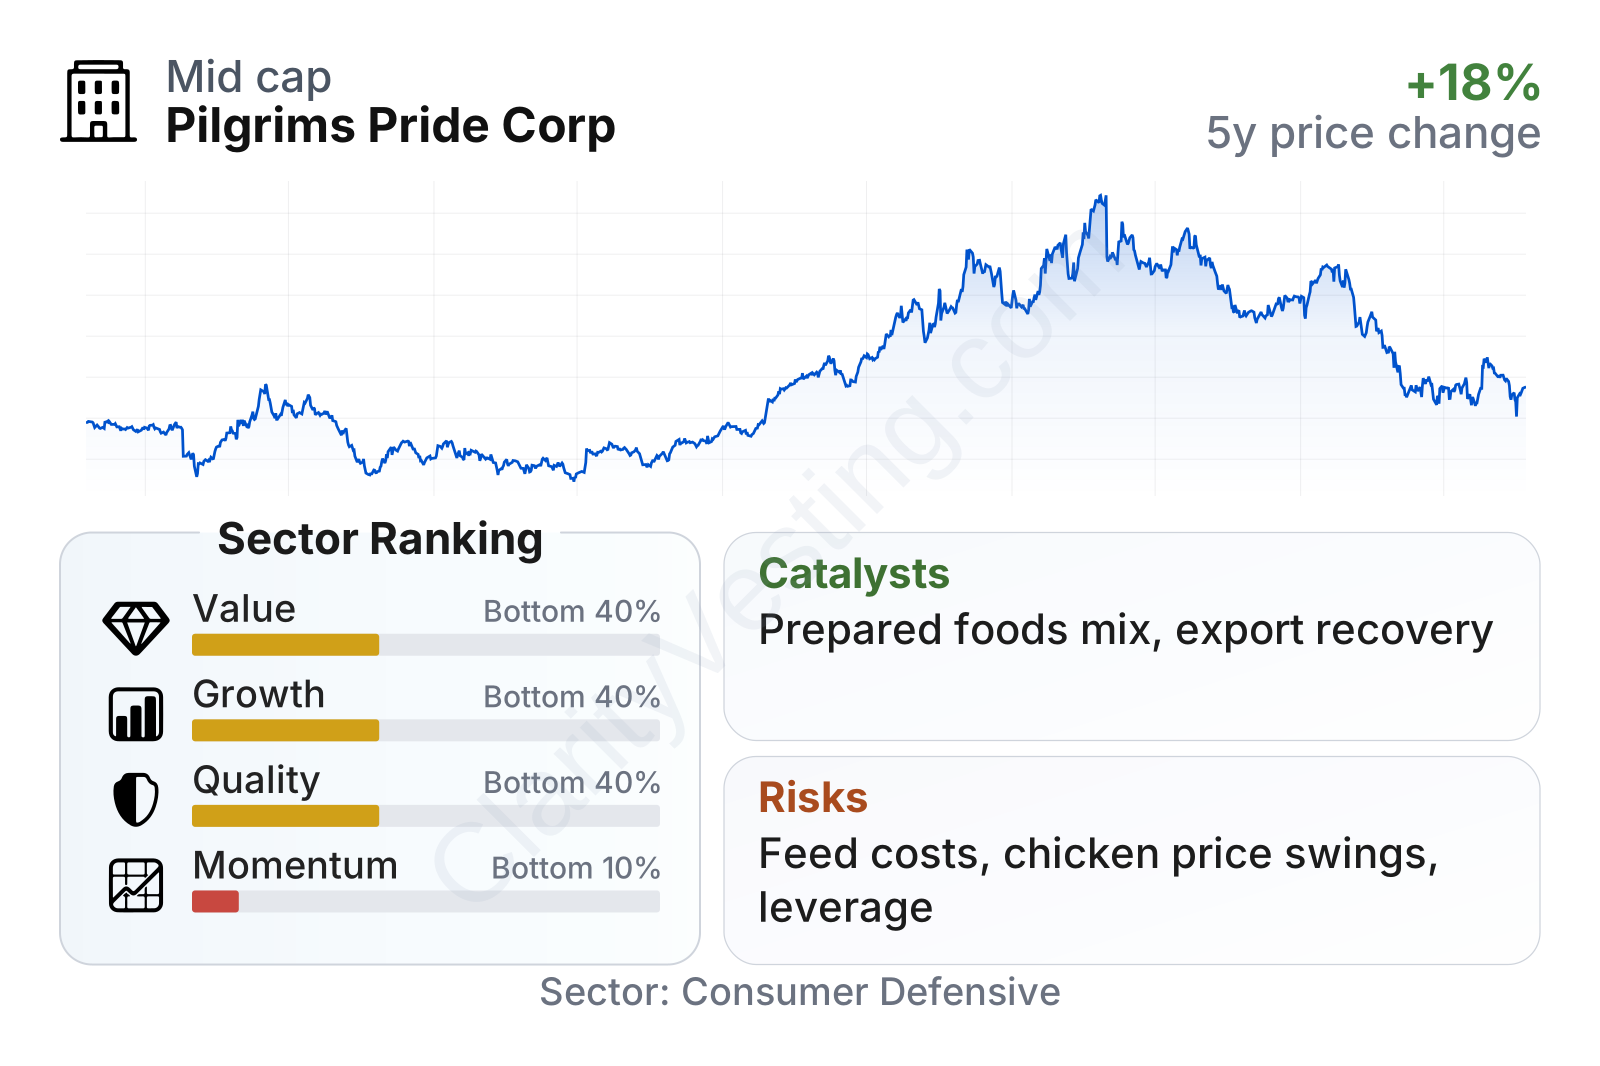
Pilgrim’s Pride sits in the mid-cap range, with relatively low share-price volatility versus the broader market. The current profile looks mixed. Earnings-based valuation appears lower than the sector average, but growth, quality, and recent market momentum rank below many packaged-food peers. The table also points to a business that has improved margins over a multi-year period, yet still operates with thinner profitability and somewhat higher leverage than the sector median.
Growth
Pilgrim’s Pride operates in a part of the food industry that tends to benefit from steady long-term demand. Chicken remains one of the most affordable animal proteins in many markets, and that matters when consumers trade down from more expensive meats. This does not make the company a fast structural growth business in the way a technology company might be, but it does place it in a durable category with global consumption support.
The company’s strategy for future growth is sensible because it is not relying only on commodity chicken volumes. Management has been pushing further into branded, prepared, and convenience-oriented products, especially in the U.S. and Europe, where value-added items can carry better margins and more stable customer relationships than spot-market meat sales. Geographic diversification also reduces dependence on any single market’s pricing cycle.
Revenue growth has been uneven quarter to quarter, which is normal in this industry because selling prices, export demand, and feed economics can move around significantly. The most recent readings show slower top-line momentum than the broader sector, but the longer-term picture is more stable than one weak year might suggest. Over five years, revenue per share has grown roughly in line with the sector.
Cash generation is another important piece of the growth picture. Free cash flow has been volatile, but it turned very strong in the recent upcycle before cooling again. That pattern fits a cyclical food processor: cash flow can surge when margins expand and retreat when working capital, capital spending, or commodity conditions become less favorable. Even so, the company remains cash generative over time rather than purely growth-by-borrowing.
A meaningful catalyst is operational mix. If Pilgrim’s Pride continues shifting toward prepared foods and branded products, it could reduce some of the earnings swings that come from commodity chicken pricing alone. Another catalyst is export and foodservice recovery in key regions, particularly if feed costs stay manageable. Public company updates in 2026 also indicate continued attention to plant efficiency, product mix, and disciplined capital allocation rather than aggressive expansion for its own sake.
Risks
This article is for informational purposes only and does not constitute financial advice. Some content is AI-generated. See Disclaimer


