Stock Analysis · Pinnacle West Capital Corp (PNW)
Overview
Pinnacle West Capital Corp is a regulated electric utility holding company. Its main business is Arizona Public Service, or APS, which generates, transmits, and distributes electricity across a large part of Arizona, including the Phoenix metropolitan area. In practical terms, the company earns most of its money by delivering power to homes, businesses, and industrial customers under rates approved by regulators rather than through a highly competitive open market.
This business model makes Pinnacle West easier to understand than many diversified corporations. Revenue is tied mainly to electricity sales, customer growth, approved rate increases, and recovery of fuel and infrastructure costs. Arizona remains one of the faster-growing states in the U.S., which matters because more residents and more commercial activity can support long-term demand for grid investment and electric service.
The revenue mix is heavily concentrated in regulated electricity operations. Based on company disclosures, the business is overwhelmingly centered on APS, while non-utility and other activities are small.
- Regulated electricity service through APS: about 95% to 99% of total revenue. This includes retail electricity sales to residential, commercial, and industrial customers, plus transmission and other regulated services.
- Other activities: about 1% to 5% of total revenue. This generally includes holding-company level and other non-core operations, which are minor compared with the utility business.
Over the last several years, total revenue has trended upward, and operating income has also improved, although interest expense has risen as the company has funded a large capital program. That pattern is common for regulated utilities: they spend heavily on the grid first and aim to recover those investments over time through the regulatory process.
The business flow shows a utility with rising revenue and operating profit over time, but also with noticeably higher interest costs. That combination points to a company expanding and modernizing its system while becoming more dependent on financing.
Key Figures
| Metric | Value | Sector ⓘ |
|---|---|---|
| Date | Oct 17, 2026 | |
| Context | ||
| Sector | Utilities | |
| Industry | Utilities - Regulated Electric | |
| Market Cap ⓘ | $12.31B | |
| Beta ⓘ | 0.42 | |
Value (Cheapness) | ||
| P/E Ratio ⓘ | 19.17 | 17.28 |
| P/B Ratio ⓘ | 1.82 | 1.51 |
| FCF Yield ⓘ | -7.14% | 0.65% |
| Dividend Yield ⓘ | 3.63% | 3.77% |
| EBIT / EV ⓘ | 4.41% | 5.01% |
| PEG ⓘ | 3.58 | |
Growth (Business expansion) | ||
| Revenue Growth ⓘ | 7.10% | 6.10% |
| RPS Growth (5Y CAGR) ⓘ | 6.84% | 3.87% |
| EPS Growth (5Y CAGR) ⓘ | -21.79% | -11.30% |
| BVPS Growth (5Y CAGR) ⓘ | 2.94% | 4.23% |
| Margin Growth (5Y Trend) ⓘ | -4.02% | 3.57% |
| FCF Growth (5Y CAGR) ⓘ | N/A | -8.84% |
| DPS Growth (5Y CAGR) ⓘ | 1.51% | 4.84% |
Quality (Business durability) | ||
| ROIC (Latest) ⓘ | 6.00% | 6.53% |
| ROA (Latest) ⓘ | 2.05% | 3.20% |
| ROIC (5Y Median) ⓘ | 5.88% | 5.95% |
| ROA (5Y Median) ⓘ | 2.16% | 2.75% |
| Net Debt / EBIT (Latest) ⓘ | 9.28 | 7.13 |
| Net Debt / EBIT (5Y Median) ⓘ | 10.67 | 7.23 |
| Net Debt / EBITDA (Latest) ⓘ | 5.12 | 4.31 |
| Net Debt / Assets ⓘ | 34.87% | 38.42% |
| EBITDA / Interest ⓘ | 4.79 | 4.58 |
| Operating Margin (Latest) ⓘ | 22.05% | 20.83% |
| Operating Margin (5Y Median) ⓘ | 21.73% | 20.08% |
| Debt to Equity (Latest) ⓘ | 161.62% | 137.69% |
| Profit Margin (Latest) ⓘ | 11.53% | 11.37% |
| Free Cash Flow (Latest) ⓘ | -$878.54M | |
Momentum (Price trend) | ||
| 3Y Return ⓘ | +52.75% | +52.37% |
| 12M Return (excl. last month) ⓘ | +12.36% | +8.84% |
| 6M Return ⓘ | +1.16% | -3.95% |
| Price vs. 200-Day MA ⓘ | +3.74% | -0.79% |
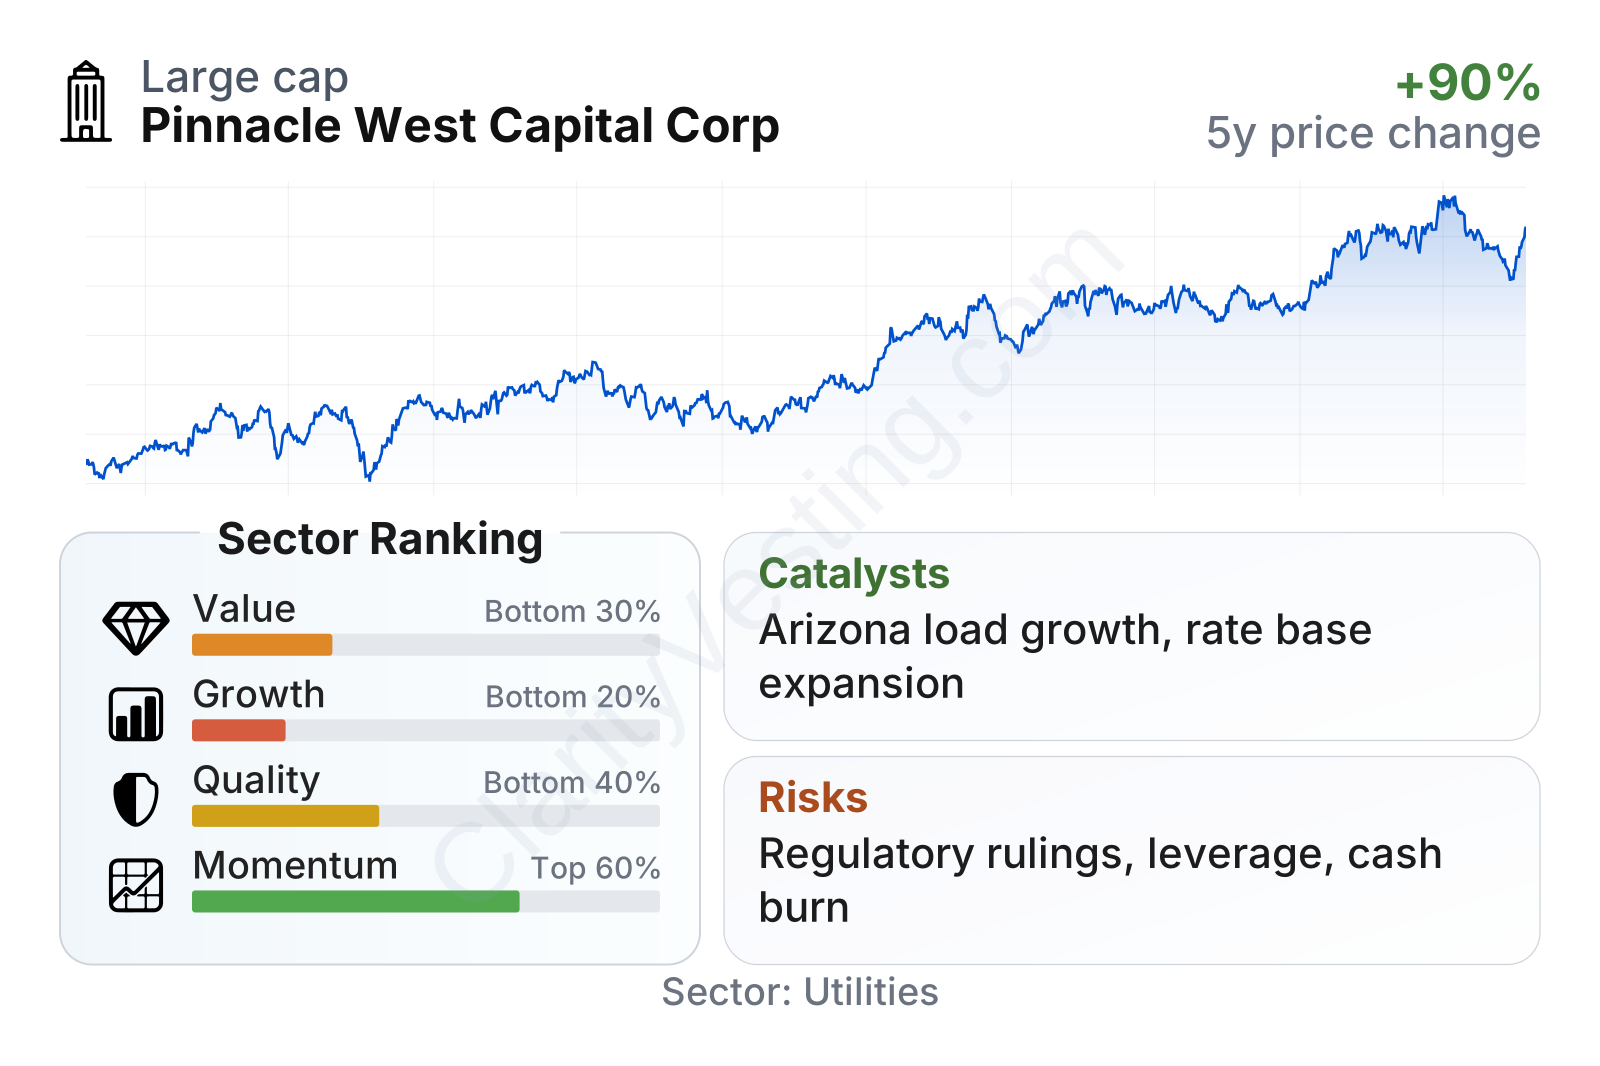
Pinnacle West is a mid-sized regulated utility with relatively low share-price volatility, as reflected in its beta well below 1. Its dividend yield is roughly in line with the sector, while valuation multiples sit close to sector norms rather than at a deep discount. The weaker areas in the broader snapshot are growth ranking, free cash flow, and leverage, while margins remain respectable for a regulated electric utility.
The share price has climbed strongly since 2021, with a particularly sharp move through late 2024 into 2026. That rise helps explain why the dividend yield has moved down from earlier levels above 5% to closer to 3% to 4% recently: the payout did not collapse, but the stock price increased faster.
Growth
For a utility, growth does not usually come from launching new products at high speed. It comes from population growth, rising demand, and capital investment that can be added to the regulated asset base. On that front, Pinnacle West operates in an attractive territory. Arizona has been one of the more compelling U.S. markets for utility demand because of population inflows, housing development, business expansion, and power needs linked to air conditioning and data-intensive activity.
The company’s strategy is built around investing in the grid, generation resources, and system reliability. That is sensible for a regulated utility because successful investment can support future earnings if regulators allow those costs to be recovered in customer rates. Management has also emphasized cleaner generation, transmission upgrades, and meeting peak demand in a fast-growing service area.
Revenue per share has moved up steadily over the past five years, with only a small pause most recently. That is a constructive sign because it shows the company has been expanding its business base, even if earnings growth has not been as smooth.
A meaningful catalyst is electricity demand tied to Arizona’s economic expansion. New commercial load, including energy-intensive facilities, can be especially valuable because they increase system usage and can justify larger infrastructure programs. Another positive factor is the regulated nature of the business: when rate cases or other recovery mechanisms are favorable, investment can translate into future earnings with better visibility than in most industries.
Recent company updates have also centered on ongoing capital spending, resource planning, and customer growth in APS territory. For a long-term view, the most important opportunity is not a single headline but the combination of demographic growth and the need for grid upgrades in a hot, expanding state.
Free cash flow has remained negative and has worsened recently, but for utilities this often reflects heavy infrastructure spending rather than a weak core business. The key question is whether those projects earn an adequate regulated return later on. If they do, today’s cash outflow can support future earnings capacity; if recovery is delayed or reduced, the pressure remains.
Risks
This article is for informational purposes only and does not constitute financial advice. Some content is AI-generated. See Disclaimer


