Stock Analysis · PNC Financial Services Group Inc (PNC)
Overview
PNC Financial Services Group is a large U.S. regional bank. It provides everyday banking services such as checking accounts, savings, mortgages, auto and business loans, credit products, treasury services, and wealth management. Its customer base spans consumers, small businesses, middle-market companies, large corporations, and institutional clients. PNC also has a sizable asset management and advisory business, which adds fee income alongside traditional lending income.
Like most banks, PNC earns money from a mix of interest income and fees. In simple terms, the largest source usually comes from the spread between what the bank earns on loans and securities and what it pays on deposits and other funding. Public filings also show meaningful contributions from service charges, asset management, card and capital markets fees, and residential mortgage-related activities. Based on PNC’s recent reporting structure, the main revenue sources can be summarized as follows:
- Net interest income: about 60% to 70% of total revenue in a typical year. This is the core banking engine and reflects interest earned on commercial loans, consumer loans, mortgages, securities, and other earning assets, minus interest paid on deposits and borrowings.
- Asset management and related fees: about 8% to 12%. This includes investment management, estate services, and other advisory activities.
- Service charges and other consumer/commercial banking fees: about 5% to 10%. These come from deposit accounts, treasury management, and transaction services.
- Card and cash management, capital markets, and lending-related fees: about 10% to 15% combined. This includes corporate advisory, underwriting-related activities, trading-related revenue, and payment services.
- Residential mortgage and other smaller noninterest income lines: usually less than 10% combined. These can vary from year to year depending on interest rates and loan demand.
Recent income trends show that total revenue has expanded strongly since 2021, while profit has remained resilient despite much higher interest expense across the banking sector. That pattern matters because it suggests PNC has been able to keep earnings relatively stable while funding costs moved sharply higher.
Over the last several years, revenue has risen from roughly $20 billion to nearly $34 billion, while net income has stayed in the mid-single-digit billions before moving higher again in 2025. The most visible pressure point has been interest expense, which climbed rapidly during the higher-rate period, but operating discipline helped preserve profitability.
Key Figures
| Metric | Value | Sector ⓘ |
|---|---|---|
| Date | Oct 19, 2026 | |
| Context | ||
| Sector | Financial Services | |
| Industry | Banks - Regional | |
| Market Cap ⓘ | $86.73B | |
| Beta ⓘ | 0.93 | |
Value (Cheapness) | ||
| P/E Ratio ⓘ | 11.58 | 12.26 |
| P/B Ratio ⓘ | 1.40 | 1.23 |
| FCF Yield ⓘ | 8.63% | 10.40% |
| Dividend Yield ⓘ | 3.30% | 3.02% |
| EBIT / EV ⓘ | 5.64% | 8.14% |
| PEG ⓘ | 1.57 | |
Growth (Business expansion) | ||
| Revenue Growth ⓘ | 10.90% | 9.25% |
| RPS Growth (5Y CAGR) ⓘ | 16.86% | 12.19% |
| EPS Growth (5Y CAGR) ⓘ | 0.38% | -9.36% |
| BVPS Growth (5Y CAGR) ⓘ | 4.12% | 4.99% |
| Margin Growth (5Y Trend) ⓘ | -10.50% | -3.86% |
| FCF Growth (5Y CAGR) ⓘ | -44.73% | 4.81% |
| DPS Growth (5Y CAGR) ⓘ | 8.58% | 8.79% |
Quality (Business durability) | ||
| ROIC (Latest) ⓘ | 5.92% | 9.49% |
| ROE (Latest) ⓘ | 12.70% | 13.87% |
| ROA (Latest) ⓘ | 1.32% | 1.54% |
| ROIC (5Y Median) ⓘ | 5.99% | 7.86% |
| ROE (5Y Median) ⓘ | 10.59% | 12.17% |
| ROA (5Y Median) ⓘ | 1.08% | 1.30% |
| Net Debt / EBIT (Latest) ⓘ | 6.07 | 0.99 |
| Net Debt / EBIT (5Y Median) ⓘ | 2.13 | 0.73 |
| Net Debt / EBITDA (Latest) ⓘ | 3.85 | 0.91 |
| Operating Margin (Latest) ⓘ | 26.71% | 22.30% |
| Operating Margin (5Y Median) ⓘ | 24.98% | 24.63% |
| Debt to Equity (Latest) ⓘ | 127.91% | 58.04% |
| Profit Margin (Latest) ⓘ | 31.68% | 26.57% |
| Free Cash Flow (Latest) ⓘ | $7.49B | |
Momentum (Price trend) | ||
| 3Y Return ⓘ | +103.08% | +88.26% |
| 12M Return (excl. last month) ⓘ | +18.99% | +19.24% |
| 6M Return ⓘ | +0.49% | +4.70% |
| Price vs. 200-Day MA ⓘ | -3.18% | +3.66% |
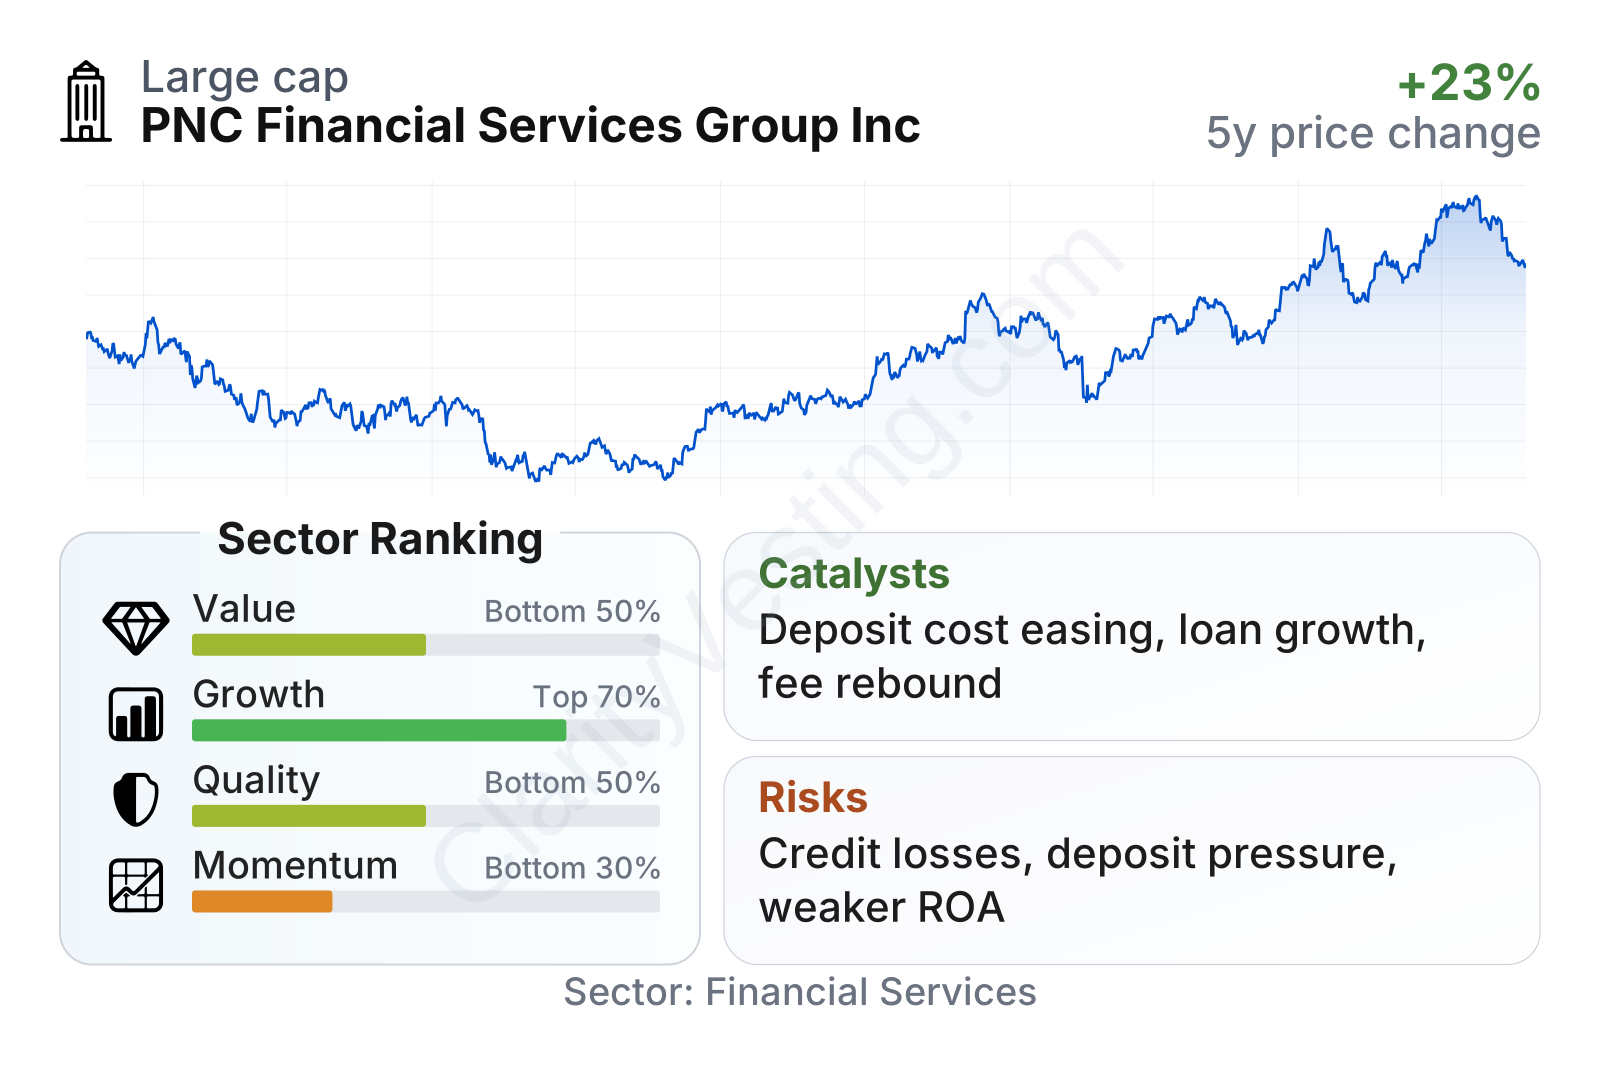
PNC is one of the larger banks in the regional banking group, with a market value in the tens of billions of dollars and a beta just under 1, which suggests price swings broadly in line with the overall market. On valuation, the shares trade near the sector median on earnings but at a modest premium on book value. Growth measures are better than many peers, especially on revenue expansion over one and five years, while profitability and balance-sheet efficiency sit closer to the middle or lower half of the peer group. Price performance has been strong over three years, but shorter-term momentum has cooled.
Growth
Banking is not a fast-growing industry in the way software or semiconductors can be, but it remains a vital sector tied to economic activity, lending demand, payment flows, and household wealth. For a bank like PNC, long-term growth usually comes from gaining deposits, expanding loans carefully, increasing fee-based business, and improving efficiency rather than from explosive top-line jumps. That makes scale, customer relationships, and credit discipline especially important.
PNC’s strategy appears sensible for that environment. The company combines a broad regional banking franchise with corporate banking and wealth management, giving it several ways to grow even when one line slows down. Its mix is helpful because fee businesses can soften the effect of interest-rate swings, while the traditional lending franchise can benefit when loan demand and deposit spreads improve. The company has also spent years building a larger national presence in selected businesses rather than relying only on branch-heavy expansion.
Earnings per share have been fairly steady through the rate cycle and moved to a higher level in 2025, which points to an earnings base that has held up better than some investors may assume for a regional bank. The five-year EPS growth rate is modest in absolute terms, but it compares favorably with a sector median that has been weaker. That suggests resilience more than rapid expansion.
Book value per share, an important measure for banks because it reflects the equity base supporting the balance sheet, has recovered well from the 2022 drop and has continued to rise. That is encouraging because sustained book value growth often supports long-term earnings capacity. Revenue per share growth over five years has also been ahead of the sector median, showing that PNC has expanded its business meaningfully even if margin trends have been less impressive.
Potential catalysts are fairly clear. If deposit costs stabilize or ease, net interest income can improve. If business confidence stays healthy, PNC can benefit from more commercial lending, treasury activity, capital markets work, and wealth management balances. In addition, large banks with strong corporate relationships often gain when smaller competitors pull back after periods of regulatory or funding stress. Recent operating trends, including stronger earnings and book value progression, support the idea that PNC is positioned to participate in that kind of normalization.
Risks
This article is for informational purposes only and does not constitute financial advice. Some content is AI-generated. See Disclaimer


