Stock Analysis · Perseus Mining Limited (PMNXF)
Overview
Perseus Mining Limited is a gold producer focused on West Africa. The company owns and operates gold mines in Côte d’Ivoire and Ghana, and its business is straightforward: it mines gold, processes the ore, and sells the finished metal. For a long-term reader, this means Perseus is tied mainly to two things: how much gold it can produce at a reasonable cost, and the price it receives for that gold.
The company’s operating base is centered on three producing assets: Yaouré in Côte d’Ivoire, Sissingué in Côte d’Ivoire, and Edikan in Ghana. In recent company reporting, Perseus has also highlighted its development pipeline, particularly the Nyanzaga project in Tanzania, which is intended to extend growth beyond the current mine portfolio and reduce dependence on its existing operations over time.
Revenue is overwhelmingly generated by gold sales. Based on recent company disclosures and operating structure, the business can be understood as follows:
- Gold sales from Yaouré: the largest contributor, estimated at roughly 40% to 50% of group output and revenue in recent periods. This is a large-scale open-pit operation and one of the company’s most important cash generators.
- Gold sales from Edikan: estimated at roughly 30% to 40% of group output and revenue. Edikan is the company’s long-running Ghanaian mine and remains a meaningful production base.
- Gold sales from Sissingué: estimated at roughly 10% to 20% of group output and revenue. This mine is smaller than Yaouré and Edikan but still contributes to overall diversification.
- Other income: typically a very small share, including items such as interest income or minor non-core receipts rather than a separate operating business.
In practice, Perseus is not diversified across many metals or business lines. That concentration makes the company easy to understand, but it also means performance depends heavily on mine execution, reserve replacement, and the gold market.
The financial flow over the last several years points to a business that has benefited from rising revenue and very strong operating profitability. The latest annual picture shows revenue moving back above $1.5 billion, with operating income and net income also rebounding strongly. That suggests the company’s asset base is currently producing healthy margins rather than merely growing volume.
The broad pattern is encouraging: revenue and gross profit have expanded materially over time, while overhead appears relatively contained compared with sales. That is the profile of a miner whose recent earnings strength has come more from efficient operations and favorable gold pricing than from heavy administrative spending.
Key Figures
| Metric | Value | Sector ⓘ |
|---|---|---|
| Date | Oct 24, 2026 | |
| Context | ||
| Sector | Basic Materials | |
| Industry | Gold | |
| Market Cap ⓘ | $5.70B | |
| Beta ⓘ | 1.03 | |
Value (Cheapness) | ||
| P/E Ratio ⓘ | 13.44 | 16.92 |
| P/B Ratio ⓘ | 2.73 | 1.66 |
| FCF Yield ⓘ | 9.58% | 5.83% |
| Dividend Yield ⓘ | 2.23% | 2.07% |
| EBIT / EV ⓘ | 22.77% | 6.38% |
| PEG ⓘ | 1.58 | |
Growth (Business expansion) | ||
| Revenue Growth ⓘ | 31.40% | 11.25% |
| RPS Growth (5Y CAGR) ⓘ | 5.87% | 4.49% |
| EPS Growth (5Y CAGR) ⓘ | N/A | -15.24% |
| BVPS Growth (5Y CAGR) ⓘ | 7.93% | 5.49% |
| Margin Growth (5Y Trend) ⓘ | 23.93% | -1.54% |
| FCF Growth (5Y CAGR) ⓘ | -12.22% | 0.37% |
| DPS Growth (5Y CAGR) ⓘ | 61.57% | 5.91% |
Quality (Business durability) | ||
| ROIC (Latest) ⓘ | N/A | 9.59% |
| ROA (Latest) ⓘ | 31.80% | 4.92% |
| ROIC (5Y Median) ⓘ | 20.23% | 7.91% |
| ROA (5Y Median) ⓘ | 14.97% | 3.92% |
| Net Debt / EBIT (Latest) ⓘ | -0.73 | 1.36 |
| Net Debt / EBIT (5Y Median) ⓘ | -1.26 | 1.69 |
| Net Debt / EBITDA (Latest) ⓘ | -0.60 | 0.93 |
| Net Debt / Assets ⓘ | -31.49% | 13.69% |
| EBITDA / Interest ⓘ | 74.47 | 12.38 |
| Operating Margin (Latest) ⓘ | 46.22% | 13.24% |
| Operating Margin (5Y Median) ⓘ | 45.92% | 11.82% |
| Debt to Equity (Latest) ⓘ | 0.09% | 40.30% |
| Profit Margin (Latest) ⓘ | 28.86% | 6.38% |
| Free Cash Flow (Latest) ⓘ | $546.47M | |
Momentum (Price trend) | ||
| 3Y Return ⓘ | +340.36% | +73.47% |
| 12M Return (excl. last month) ⓘ | +73.69% | +27.59% |
| 6M Return ⓘ | +10.96% | -4.02% |
| Price vs. 200-Day MA ⓘ | +10.74% | -0.65% |
Perseus stands out for balance sheet strength and profitability. It carries net cash rather than meaningful net debt, debt-to-equity is close to zero, and interest coverage is far above sector norms. Operating margin is unusually strong for a gold producer, and returns on assets are well above the broader sector. Growth metrics are also favorable, especially recent revenue growth and the longer-term expansion in book value per share.
The main softer area is free cash flow growth over a five-year view, which has been uneven despite strong current free cash flow generation. That is not unusual in mining, where development spending and mine sequencing can cause cash flow to move around from year to year. Overall, the table describes a mid-sized miner with above-average quality, solid growth, and strong recent market performance, trading at an earnings multiple below the sector median but with a higher price-to-book ratio that reflects asset quality and profitability.
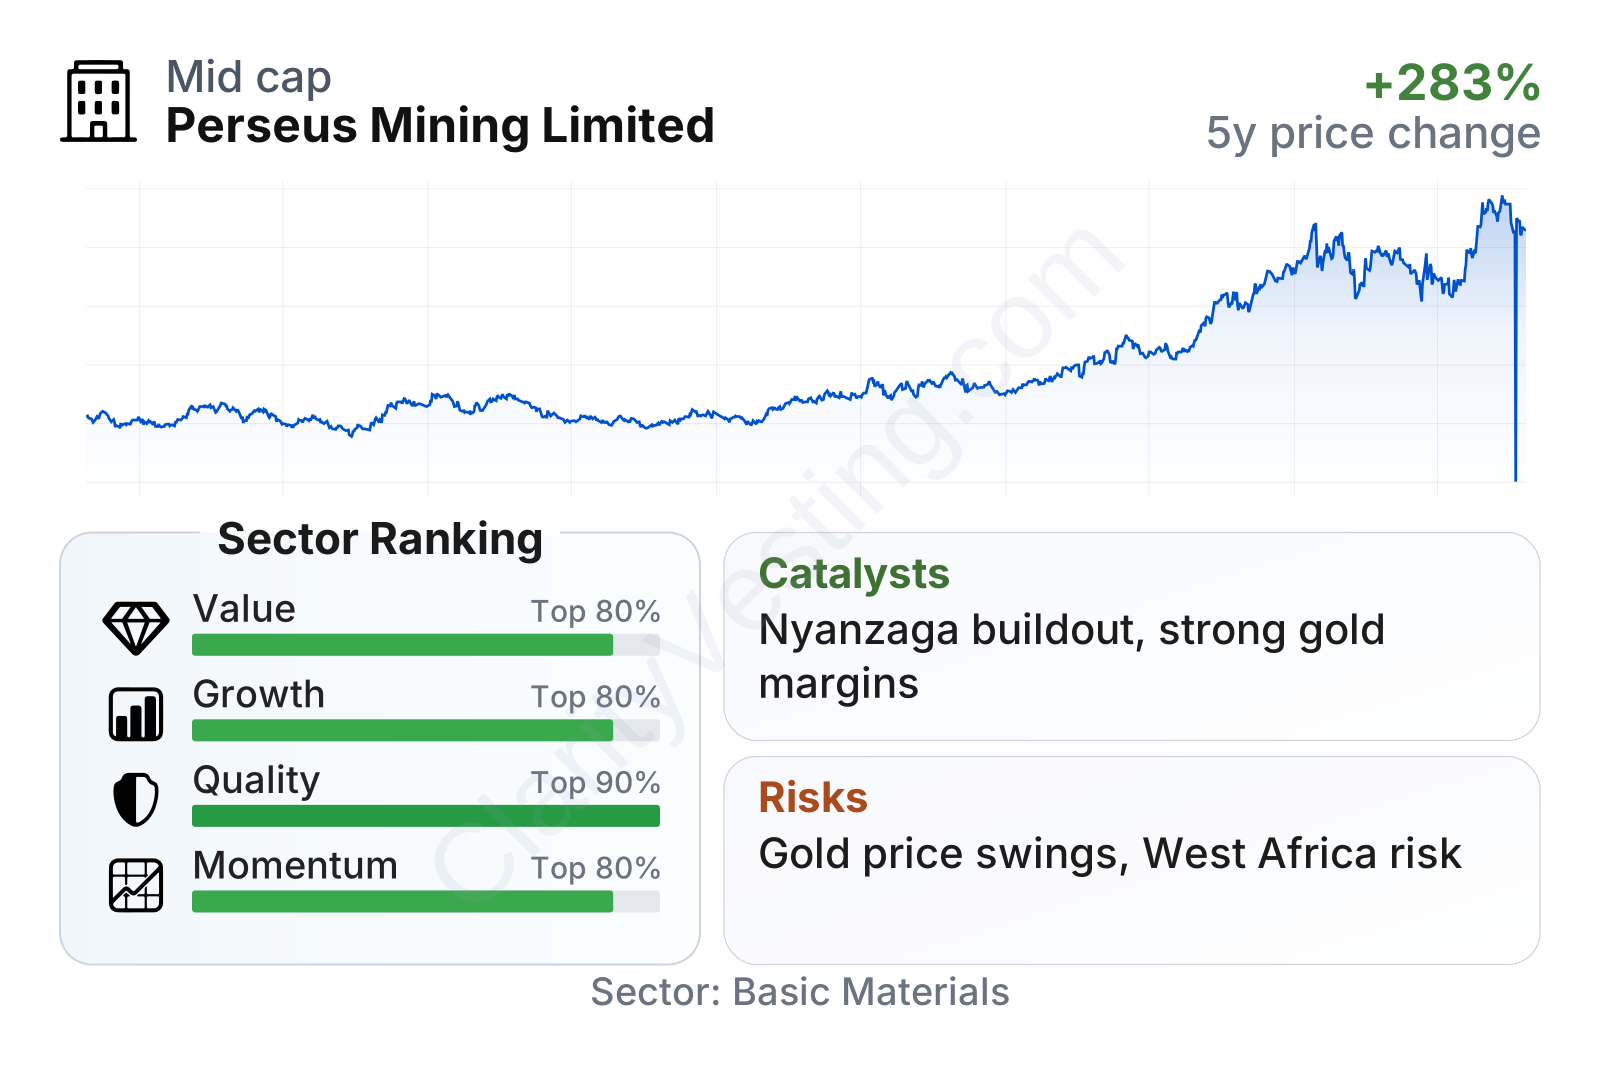
The share price trend has been strong over the past several years, especially since 2024. Momentum has clearly outpaced the broader sector, which usually signals that the market has been recognizing higher gold prices, strong operations, and progress on the company’s development plans.
Growth
Perseus operates in a sector that still has a clear long-term role. Gold remains important as a store of value, a reserve asset for central banks, and a defensive asset during periods of inflation, currency weakness, or geopolitical tension. That does not make the sector a steady compounder in the same way as some software or consumer businesses, but it does mean well-run producers can have attractive multi-year periods when gold prices and operating performance move in the right direction together.
Perseus’s strategy is logical for that setting. It has built a portfolio of producing mines that generate cash today, while also advancing a new development project to support future output. The key growth point is not just producing more ounces, but extending mine life and spreading operating risk across more assets. For a mining company, that is often the difference between a short-lived earnings peak and a more durable production profile.
A major catalyst is the Nyanzaga Gold Project in Tanzania. Recent company updates have framed it as the next major buildout for Perseus, with the potential to add another meaningful production center once construction and commissioning progress. If management executes well, Nyanzaga could improve scale, diversify country exposure beyond Ghana and Côte d’Ivoire, and lengthen the group’s growth runway.
Another favorable element is the company’s financial position. Because Perseus has generated strong earnings and free cash flow and does not appear burdened by heavy leverage, it has more room than many peers to fund development, absorb cost inflation, or pursue additional exploration and project opportunities without placing the balance sheet under major strain.
Recent operating and financial momentum also matters. Revenue growth of roughly 31% year over year, very high operating margins, and strong stock performance all point to a company that has been executing effectively while benefiting from a supportive gold backdrop. In mining, growth is rarely linear, but Perseus currently looks positioned around a combination that the market generally values: producing assets, a visible project pipeline, and enough financial flexibility to move on opportunities.
Risks
This article is for informational purposes only and does not constitute financial advice. Some content is AI-generated. See Disclaimer


