Stock Analysis · Pro Medicus Limited (PMCUF)
Overview
Pro Medicus Limited is an Australian healthcare technology company focused on medical imaging software. Its core product family, Visage, helps hospitals, radiology groups, and academic medical centers store, view, share, and analyze medical images such as CT, MRI, X-ray, and mammography scans. In simple terms, the company provides the software infrastructure that lets doctors read scans quickly across desktops, web browsers, and enterprise systems.
The business is aimed at a part of healthcare that has attractive long-term characteristics: imaging volumes tend to rise over time, hospitals need faster workflows, and providers increasingly want cloud-enabled platforms that can work across multiple sites. Pro Medicus has built its reputation around speed, scalability, and high-end enterprise imaging, especially for large institutions.
Revenue mainly comes from software licensing, implementation, and ongoing support and maintenance tied to enterprise imaging contracts. Based on company reporting and business model disclosures, the mix is best understood as follows:
- Software licenses and transaction-based usage fees: approximately 55% to 70% of revenue. This is the main economic engine and includes fees linked to use of the Visage imaging platform.
- Support, maintenance, and recurring service revenue: approximately 20% to 35% of revenue. This usually covers ongoing customer support, upgrades, and long-term service arrangements.
- Implementation, hardware, and other services: approximately 5% to 15% of revenue. This includes deployment work and smaller ancillary items.
Geographically, the United States appears to be the dominant market and the main growth driver, with Australia contributing a smaller share. That concentration matters because the company is increasingly tied to large U.S. health systems, where contract sizes can be significant and implementation cycles are long.
The financial profile is unusually strong for a healthcare software company. Revenue has expanded steadily over the last several years while operating expenses have risen much more slowly, allowing a very large share of additional sales to turn into operating profit and cash flow. The one caution is that the latest annual figures include some line items that look unusual versus prior years, so headline profitability should be interpreted alongside company disclosures rather than viewed in isolation.
The broad picture is still clear: sales have risen sharply since 2022, gross profit remains very high, and operating leverage has been powerful. That combination helps explain why the market has consistently assigned the company a premium valuation.
Key Figures
| Metric | Value | Sector ⓘ |
|---|---|---|
| Date | Oct 17, 2026 | |
| Context | ||
| Sector | Healthcare | |
| Industry | Health Information Services | |
| Market Cap ⓘ | $12.98B | |
| Beta ⓘ | 0.56 | |
Value (Cheapness) | ||
| P/E Ratio ⓘ | 68.98 | 24.79 |
| P/B Ratio ⓘ | 26.75 | 3.08 |
| FCF Yield ⓘ | 1.93% | 3.15% |
| Dividend Yield ⓘ | 0.60% | 1.94% |
| EBIT / EV ⓘ | N/A | 0.57% |
| PEG ⓘ | N/A | |
Growth (Business expansion) | ||
| Revenue Growth ⓘ | 18.20% | 7.45% |
| RPS Growth (5Y CAGR) ⓘ | 29.29% | 8.61% |
| EPS Growth (5Y CAGR) ⓘ | 31.66% | -17.81% |
| BVPS Growth (5Y CAGR) ⓘ | 45.02% | 3.72% |
| Margin Growth (5Y Trend) ⓘ | 8.26% | -0.62% |
| FCF Growth (5Y CAGR) ⓘ | 26.81% | 1.04% |
| DPS Growth (5Y CAGR) ⓘ | 36.20% | 6.77% |
Quality (Business durability) | ||
| ROIC (Latest) ⓘ | N/A | 3.24% |
| ROA (Latest) ⓘ | 84.20% | 3.01% |
| ROIC (5Y Median) ⓘ | 48.47% | 4.60% |
| ROA (5Y Median) ⓘ | 36.03% | 1.89% |
| Net Debt / EBIT (Latest) ⓘ | -0.40 | 1.34 |
| Net Debt / EBIT (5Y Median) ⓘ | -1.03 | 1.84 |
| Net Debt / EBITDA (Latest) ⓘ | -0.39 | 1.00 |
| Net Debt / Assets ⓘ | -23.64% | 5.45% |
| EBITDA / Interest ⓘ | N/A | 9.64 |
| Operating Margin (Latest) ⓘ | 75.03% | 9.27% |
| Operating Margin (5Y Median) ⓘ | 69.46% | 7.38% |
| Debt to Equity (Latest) ⓘ | 0.49% | 28.58% |
| Profit Margin (Latest) ⓘ | 101.40% | 3.59% |
| Free Cash Flow (Latest) ⓘ | $250.84M | |
Momentum (Price trend) | ||
| 3Y Return ⓘ | +129.28% | +42.80% |
| 12M Return (excl. last month) ⓘ | -37.45% | +18.50% |
| 6M Return ⓘ | +24.73% | +7.57% |
| Price vs. 200-Day MA ⓘ | -10.09% | +5.12% |
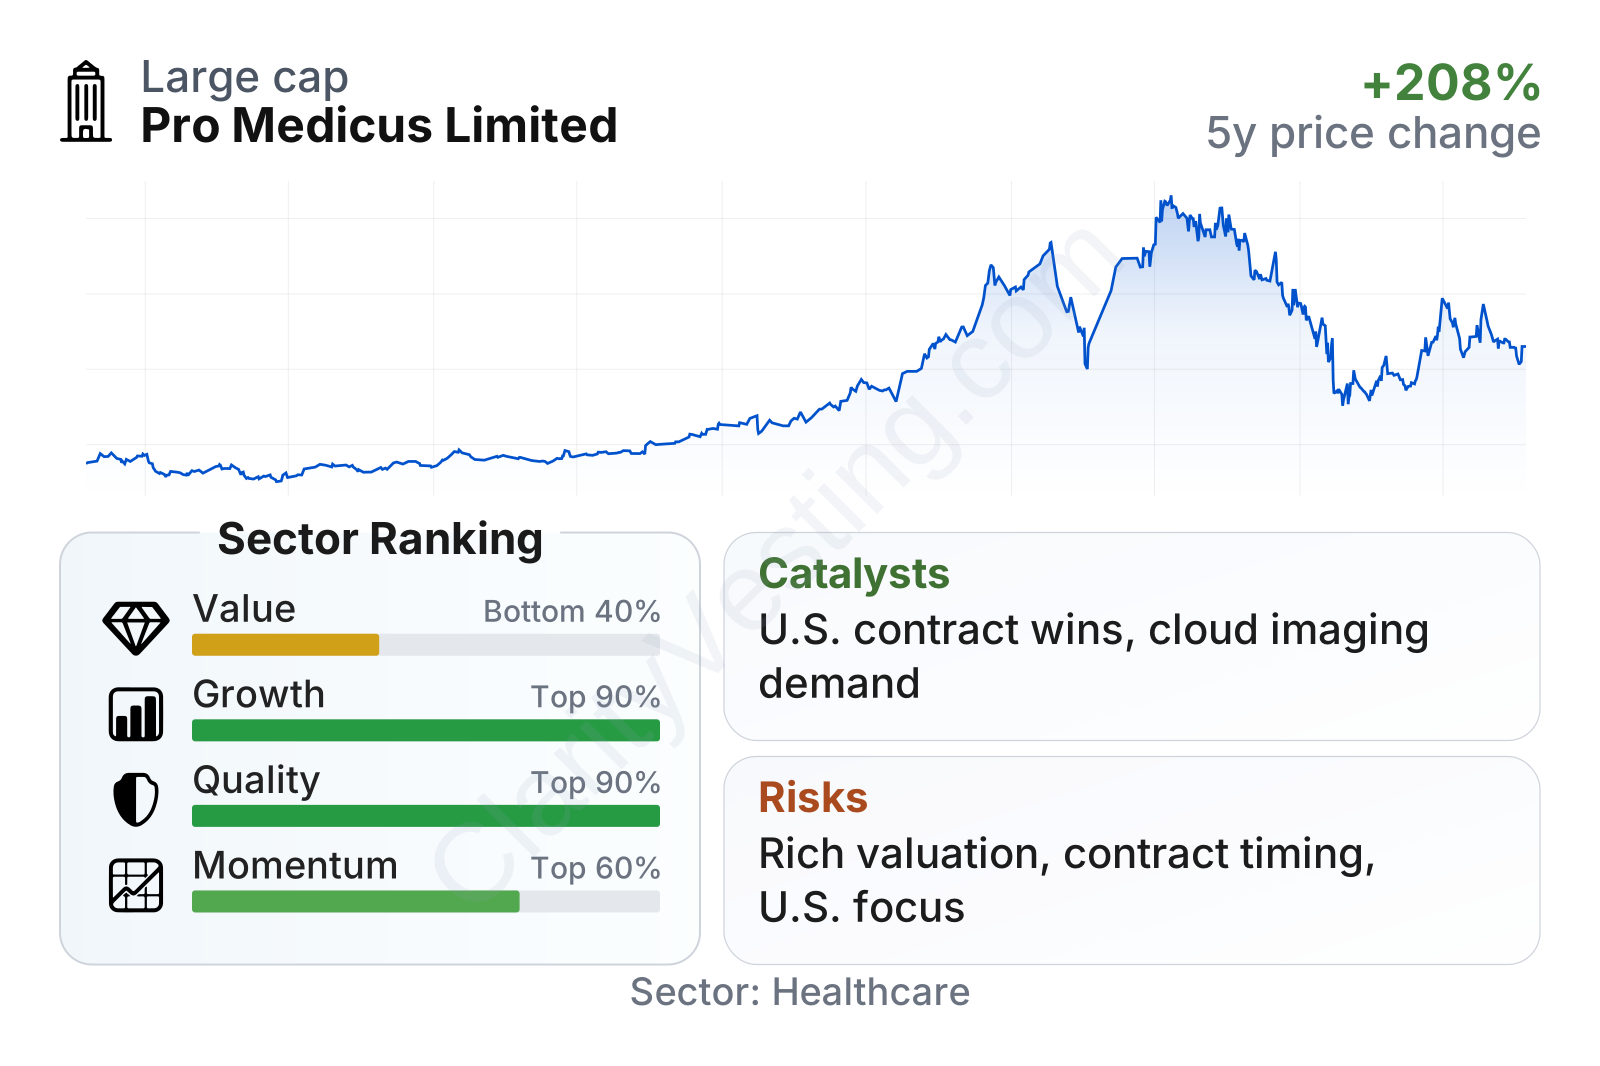
Pro Medicus stands out on growth and quality, where it ranks near the top of its healthcare peer group. Revenue growth is well above the sector median, five-year expansion in revenue per share and earnings has been exceptionally strong, and margins are far ahead of most comparable companies. The balance sheet is also a major differentiator: debt is effectively negligible, and net cash gives the company flexibility.
The weaker area is valuation. Multiples remain elevated versus the sector, even after a sharp pullback from the stock’s peak. Price momentum is mixed as well: the longer-term share performance has been strong, but the stock has also shown that sentiment can reverse quickly when expectations become too demanding.
Growth
Pro Medicus operates in a growing segment of healthcare: enterprise medical imaging and radiology IT. Several structural forces support demand. Hospitals are consolidating systems, imaging workloads continue to expand, clinicians want faster access to images across locations, and cloud-based deployment is becoming more important. These are not short-lived trends. They are linked to how modern health systems manage data, specialist workflows, and patient throughput.
The company’s strategy is coherent for this environment. Rather than chasing every customer type, Pro Medicus has focused on high-acuity, image-intensive institutions where speed and scalability matter most. That positioning can create a favorable commercial dynamic: once the software is embedded in a large health system and integrated into clinical workflows, switching becomes difficult, expensive, and operationally disruptive.
The growth record supports that thesis. Year-over-year revenue growth is running at roughly the high-teens level, clearly ahead of the healthcare sector median. Over a five-year period, revenue per share has compounded at close to 30% annually, while earnings per share have grown slightly faster. That suggests expansion is not being driven only by acquisitions or accounting effects; the business has also been converting growth into stronger economics per share.
Cash generation is another important growth indicator. Free cash flow has scaled strongly over time and remains substantial relative to the size of the business. For a software-led company with minimal leverage, that matters because it provides room to invest in product development, support large implementations, and pursue additional contracts without relying on outside financing.
A major catalyst is the company’s ability to keep winning large U.S. contracts. In recent years, Pro Medicus has announced multiple agreements with prominent health systems and academic medical centers, reinforcing its credibility in the most important market. Each major win can do more than add direct revenue: it can strengthen references, improve market visibility, and make future bids more competitive. The company’s cloud partnerships and enterprise imaging focus also align with where hospital IT spending is moving.
Risks
This article is for informational purposes only and does not constitute financial advice. Some content is AI-generated. See Disclaimer


