Stock Analysis · Polar Capital Holdings plc (PLRRF)
Overview
Polar Capital Holdings plc is a United Kingdom-based asset manager. In simple terms, it runs investment funds for institutions, financial advisers, wealth managers, and private clients, and it earns money mainly by charging fees on the assets it manages. The group is known for a multi-boutique model: instead of operating as one centralized investment house, it gives individual investment teams a high degree of autonomy while providing distribution, operations, and corporate support at the group level.
The business is centered on active management across public markets. Its fund range spans global and regional equities, thematic strategies such as technology and healthcare, and some specialist approaches including convertibles and emerging markets. Because asset managers are usually paid as a percentage of assets under management, Polar Capital’s revenue tends to move with three things: market performance, client inflows or outflows, and the mix of products it sells.
Based on company reporting, the main revenue source is management fees, with performance fees adding a smaller and more volatile contribution when investment results and fund terms allow them. Product exposure by assets under management changes over time, but recent annual reporting has shown a strong weighting toward equities and thematic franchises.
The revenue picture can be summarized as follows:
- Management fees: approximately 85% to 95% of revenue in most years. This is the recurring core of the business and is linked to average assets under management across the fund range.
- Performance fees: approximately 5% to 15% of revenue, but this can swing sharply from year to year. It depends on whether certain funds outperform stated hurdles or benchmarks.
- Other income: typically a very small share. This can include distribution-related or ancillary items, but it is not a major driver of the business.
Financially, the model has attractive features when markets are supportive: limited capital intensity, low financial leverage, and potentially strong margins. At the same time, it is inherently cyclical because fee income depends on market levels and investor sentiment. Over the last few years, Polar Capital has shown that earnings can recover quickly when flows stabilize and markets rise.
A notable recent operating trend is that revenue and profit rebounded strongly in the year ended March 2026 after a softer period. Total revenue rose from roughly £222 million to about £264 million, while net income increased from about £35 million to nearly £59 million. That pattern fits the company’s broader business model: when assets and fees improve, earnings can scale quickly.
The long-term financial flow shows a business with strong operating leverage. Revenue dipped in 2023, recovered in 2024 and 2025, and then accelerated in 2026, while operating income and net income improved even faster than sales. Interest expense has remained minimal throughout, which supports the view that this is a fee-driven business rather than a balance-sheet-driven one.
Key Figures
| Metric | Value | Sector ⓘ |
|---|---|---|
| Date | Oct 17, 2026 | |
| Context | ||
| Sector | Financial Services | |
| Industry | Asset Management | |
| Market Cap ⓘ | $1.04B | |
| Beta ⓘ | 0.92 | |
Value (Cheapness) | ||
| P/E Ratio ⓘ | 13.92 | 12.26 |
| P/B Ratio ⓘ | 6.95 | 1.23 |
| FCF Yield ⓘ | N/A | 10.40% |
| Dividend Yield ⓘ | 4.18% | 3.02% |
| EBIT / EV ⓘ | 8.49% | 8.14% |
| PEG ⓘ | 30.05 | |
Growth (Business expansion) | ||
| Revenue Growth ⓘ | 28.30% | 9.35% |
| RPS Growth (5Y CAGR) ⓘ | 4.46% | 12.19% |
| EPS Growth (5Y CAGR) ⓘ | -30.50% | -9.53% |
| BVPS Growth (5Y CAGR) ⓘ | -0.64% | 4.99% |
| Margin Growth (5Y Trend) ⓘ | -2.59% | -3.86% |
| FCF Growth (5Y CAGR) ⓘ | -0.59% | 4.81% |
| DPS Growth (5Y CAGR) ⓘ | 0.89% | 8.79% |
Quality (Business durability) | ||
| ROIC (Latest) ⓘ | N/A | 9.49% |
| ROE (Latest) ⓘ | N/A | 13.90% |
| ROA (Latest) ⓘ | N/A | 1.55% |
| ROIC (5Y Median) ⓘ | N/A | 7.86% |
| ROE (5Y Median) ⓘ | 29.27% | 12.17% |
| ROA (5Y Median) ⓘ | 17.76% | 1.30% |
| Net Debt / EBIT (Latest) ⓘ | N/A | 0.96 |
| Net Debt / EBIT (5Y Median) ⓘ | N/A | 0.73 |
| Net Debt / EBITDA (Latest) ⓘ | N/A | 0.92 |
| Operating Margin (Latest) ⓘ | N/A | 22.30% |
| Operating Margin (5Y Median) ⓘ | 28.14% | 24.63% |
| Debt to Equity (Latest) ⓘ | N/A | 58.56% |
| Profit Margin (Latest) ⓘ | 22.26% | 26.57% |
| Free Cash Flow (Latest) ⓘ | N/A | |
Momentum (Price trend) | ||
| 3Y Return ⓘ | +141.76% | +88.33% |
| 12M Return (excl. last month) ⓘ | +92.89% | +19.38% |
| 6M Return ⓘ | +36.40% | +4.75% |
| Price vs. 200-Day MA ⓘ | +19.00% | +3.50% |
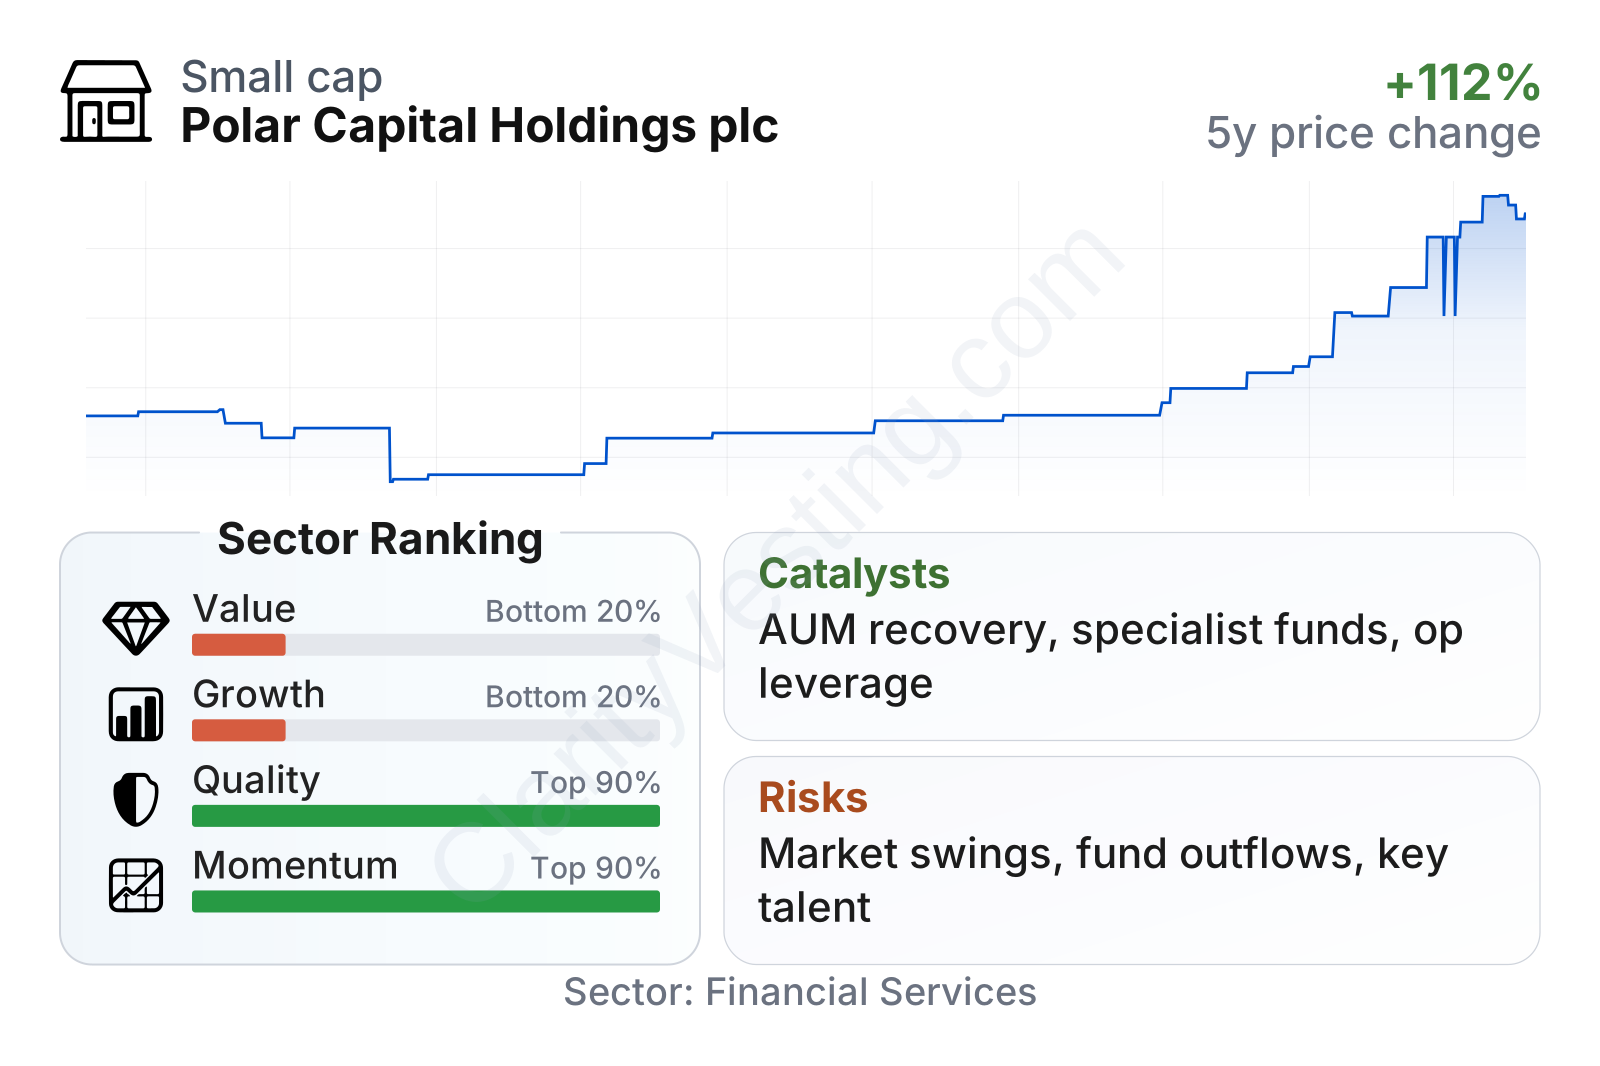
Polar Capital is a mid-sized listed asset manager with a market value around the $1 billion range and a beta slightly below 1, which suggests the stock has not been dramatically more volatile than the broader market. The recent share-price trend has been very strong, with returns over six months, the last twelve months excluding the latest month, and three years all well ahead of the sector median. That indicates that the market has already recognized a meaningful improvement in the company’s operating outlook.
The quality profile stands out more favorably than the growth profile. Profitability over time has been solid, with five-year median return on equity near 29% and operating margins above many peers. Balance-sheet risk also appears limited, helped by low leverage and very small interest expense. By contrast, longer-term growth measures are less impressive: five-year earnings, free cash flow, and book value per share have been weak compared with the sector, even though the latest year showed a clear rebound.
On income, the trailing dividend yield is around 4%, above the sector median. That is relevant because mature asset managers often attract attention for cash distributions, but those payouts remain exposed to earnings and market conditions. On valuation factors, the stock does not screen as cheap versus its sector, especially on price-to-book, even though earnings-based multiples look less extreme.
Growth
Polar Capital operates in a sector that can grow over long periods, but not in a straight line. Global savings, retirement assets, and demand for professionally managed portfolios tend to expand over time. Within that broad market, the more attractive pockets are specialist strategies where clients are willing to pay higher fees for differentiated expertise. That is important for Polar Capital, because it is not trying to compete as a giant low-cost index provider. Its strategy is built around specialist active teams, strong brand identities within funds, and distribution into institutional and wholesale channels.
That strategy makes sense if the firm can keep delivering performance in areas where clients still value active management, particularly technology, healthcare, thematic equities, and other niche capabilities. The company’s multi-team structure can also support growth by allowing it to add or retain specialist managers without forcing them into a highly centralized model. In asset management, talent retention matters a great deal, and Polar Capital’s structure is designed around that reality.
One clear catalyst is operating leverage. The recent jump in revenue translated into an even larger improvement in operating profit and net income, showing how strongly earnings can respond when assets under management rise. If market levels remain firm and net flows improve, the same mechanism could continue to support results. Another catalyst is the company’s reputation in selected investment niches, where specialized products can command stronger fees than more commoditized offerings.
Recent company reporting also points to improved business momentum into fiscal 2026, helped by stronger market conditions and a better earnings base. For a company like Polar Capital, even modest net inflows can have an outsized effect when paired with favorable markets, since both support fee-earning assets.
Book value per share fell for several years and then recovered in the latest period. That pattern matters because it suggests the business has recently rebuilt some financial strength after a weaker stretch, but it has not yet established a clear multi-year compounding trend in net asset value per share. For an asset-light manager, book value is not the main driver of worth, but the direction still helps show whether earnings are consistently being converted into lasting shareholder capital.
Risks
This article is for informational purposes only and does not constitute financial advice. Some content is AI-generated. See Disclaimer


