Stock Analysis · Preformed Line Products Company (PLPC)
Overview
Preformed Line Products Company is a long-established industrial manufacturer that makes hardware, connectors, fittings, and systems used to build and protect electric power and communications networks. Its products are typically not consumer-facing. Instead, they are used by utilities, telecom operators, cable providers, data network builders, and renewable energy developers. The company’s role is often to supply the physical components that help install, secure, insulate, splice, support, and monitor overhead and underground lines.
The business is organized around two broad end markets: energy and communications. Energy includes products for transmission, distribution, substations, and grid-related infrastructure. Communications includes solutions used in fiber optic and copper networks, including deployment hardware and accessories for broadband buildouts. PLPC also has exposure to solar-related products and monitoring systems, giving it some participation in the broader electrification and renewable build cycle.
Based on the company’s recent annual reporting, revenue is diversified first by geography and then by end market, with the United States as the largest single country but with a meaningful international presence. Public filings indicate the following approximate revenue mix is the most useful way to think about the business:
- Energy products: approximately 55% to 65% of revenue. This includes hardware and accessories for electric transmission and distribution networks, substations, grounding, line protection, and related grid components.
- Communications products: approximately 35% to 45% of revenue. This includes fiber network hardware, closures, support systems, copper-based network products, and equipment tied to broadband deployment.
- Solar and specialized monitoring solutions: a smaller share within the two categories above rather than a separately dominant segment, but strategically important because they connect PLPC to utility modernization and renewable projects.
That mix can move from year to year depending on utility spending, telecom projects, broadband funding activity, and foreign exchange. The broader pattern is that PLPC generates most of its sales from infrastructure components that are essential but relatively low-profile, which can make demand steadier than in more fashion-driven or discretionary industries.
The company’s financial flow over the last several years shows a business that expanded strongly through 2023, went through a margin reset in 2024, and then returned to revenue growth in 2025. Gross profit remained positive throughout, but the conversion from sales into operating income and net income became less efficient after the 2023 peak, suggesting cost pressure, project mix changes, or normalization after an unusually strong period.
Key Figures
| Metric | Value | Sector ⓘ |
|---|---|---|
| Date | Oct 17, 2026 | |
| Context | ||
| Sector | Industrials | |
| Industry | Electrical Equipment & Parts | |
| Market Cap ⓘ | $1.90B | |
| Beta ⓘ | 0.90 | |
Value (Cheapness) | ||
| P/E Ratio ⓘ | 42.39 | 22.10 |
| P/B Ratio ⓘ | 3.64 | 1.97 |
| FCF Yield ⓘ | 1.81% | 6.38% |
| Dividend Yield ⓘ | 0.22% | 1.94% |
| EBIT / EV ⓘ | 2.85% | 4.79% |
| PEG ⓘ | N/A | |
Growth (Business expansion) | ||
| Revenue Growth ⓘ | 25.40% | 9.30% |
| RPS Growth (5Y CAGR) ⓘ | 6.80% | 7.81% |
| EPS Growth (5Y CAGR) ⓘ | -12.42% | -13.06% |
| BVPS Growth (5Y CAGR) ⓘ | 10.90% | 6.14% |
| Margin Growth (5Y Trend) ⓘ | -2.29% | 0.88% |
| FCF Growth (5Y CAGR) ⓘ | 21.66% | 11.01% |
| DPS Growth (5Y CAGR) ⓘ | 0.08% | 9.48% |
Quality (Business durability) | ||
| ROIC (Latest) ⓘ | 8.49% | 10.84% |
| ROA (Latest) ⓘ | 6.42% | 5.41% |
| ROIC (5Y Median) ⓘ | 9.72% | 9.38% |
| ROA (5Y Median) ⓘ | 7.52% | 4.95% |
| Net Debt / EBIT (Latest) ⓘ | -0.42 | 2.08 |
| Net Debt / EBIT (5Y Median) ⓘ | 0.21 | 2.27 |
| Net Debt / EBITDA (Latest) ⓘ | -0.30 | 1.39 |
| Net Debt / Assets ⓘ | -3.55% | 19.28% |
| EBITDA / Interest ⓘ | 76.73 | 9.58 |
| Operating Margin (Latest) ⓘ | 7.90% | 10.50% |
| Operating Margin (5Y Median) ⓘ | 9.30% | 10.29% |
| Debt to Equity (Latest) ⓘ | 10.41% | 65.48% |
| Profit Margin (Latest) ⓘ | 5.82% | 6.67% |
| Free Cash Flow (Latest) ⓘ | $34.42M | |
Momentum (Price trend) | ||
| 3Y Return ⓘ | +166.30% | +61.68% |
| 12M Return (excl. last month) ⓘ | +101.03% | +12.58% |
| 6M Return ⓘ | +17.11% | 0.00% |
| Price vs. 200-Day MA ⓘ | +11.93% | +0.02% |
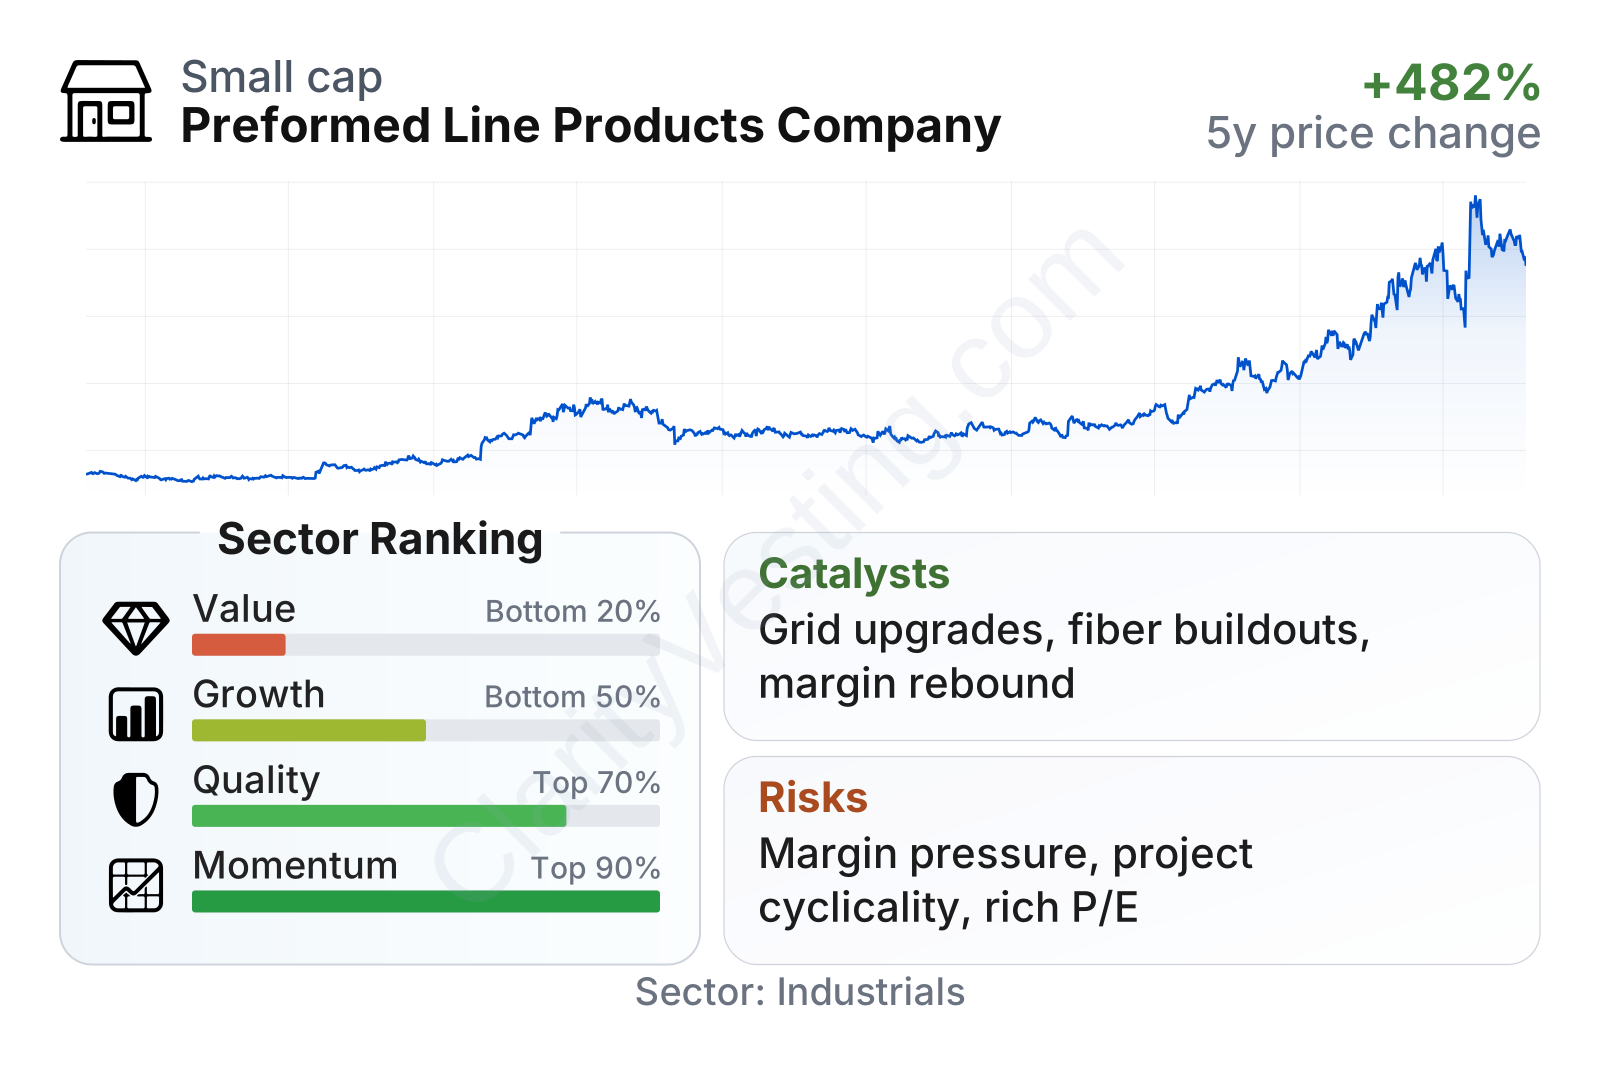
PLPC is now a mid-sized industrial company with a market value around $2 billion and a share-price volatility that has been close to the broader market rather than extremely high. The most striking feature in the latest metrics is the contrast between balance-sheet strength and valuation. Debt is very low, interest coverage is exceptionally strong, and asset profitability is respectable. At the same time, the stock trades at clearly richer multiples than the sector median, while free cash flow yield and dividend yield sit below typical industry levels. Momentum has been very strong, with share-price performance over the last 6 months, 12 months, and 3 years well ahead of the sector, which helps explain why value metrics now look stretched.
Growth
PLPC operates in sectors that have favorable long-term demand drivers. Electric grids need upgrades to handle higher power demand, grid hardening, renewable integration, and aging infrastructure replacement. On the communications side, fiber deployment, rural broadband expansion, and network densification continue to support demand for installation hardware and related components. These are not speculative themes; they are tied to long-duration infrastructure spending that often unfolds over many years.
The company’s strategy appears coherent with those trends. PLPC focuses on mission-critical components that are small relative to the total project cost but necessary for installation and reliability. That can be an attractive place to compete because customers usually care more about product performance, qualification, and supply reliability than about saving a tiny amount per part. The company also benefits from operating across both power and communications infrastructure, which provides some diversification when one end market slows.
Revenue growth has been uneven, which is normal for project-driven industrial suppliers, but the recent direction is encouraging. After a strong run in 2022 and early 2023, growth turned negative through much of 2024 before recovering. The latest year-over-year growth rate is in the mid-20% range, comfortably above the sector median, indicating that demand has reaccelerated. That said, the longer five-year revenue-per-share growth rate is only modest, so the business still looks cyclical rather than consistently high growth.
Cash generation adds another useful layer. Free cash flow turned from negative territory a few years ago to clearly positive levels, and the five-year growth rate in free cash flow has been strong. Even so, the recent trend suggests cash generation has come off its earlier peak rather than moving in a straight line upward. For a company tied to infrastructure projects and working-capital swings, that is not unusual, but it does mean growth should be viewed as solid yet not perfectly smooth.
Recent company communications and filings have continued to point toward demand linked to utility investment, communications network buildouts, and international activity. A meaningful catalyst is the broad push to modernize electric networks and expand fiber infrastructure. Another is PLPC’s ability to gain from projects that require qualified products and established customer relationships, particularly where reliability standards matter more than simple price competition.
Risks
This article is for informational purposes only and does not constitute financial advice. Some content is AI-generated. See Disclaimer


