Stock Analysis · Polibeli Group Ltd (PLBL)
Overview
Polibeli Group Ltd is a retail and distribution company with roots in Southeast Asia, operating in consumer goods and department-store-like merchandising activities. Public filings describe a business tied to the sale of consumer products, with operations exposed to everyday discretionary spending rather than high-margin software or industrial niches. In simple terms, the company buys goods, sells them through its commercial channels, and tries to earn a margin after product costs, operating expenses, and financing costs.
The biggest revenue source appears to be merchandise sales. The available public information does not provide a detailed 2026 segment split precise enough to break revenue into several verified percentages by category, so a reliable ranked list by operating segment is not available from the latest accessible materials. What is visible is that the business is primarily driven by product sales revenue, while profitability has been pressured by high operating costs and interest expense.
- Product sales: the core source of revenue, generated from consumer merchandise and retail-related trading activity.
- Other revenue streams: no clearly disclosed recurring secondary segment appears large enough in the latest public materials to quantify separately with confidence.
The financial flow over the last several years shows a recurring pattern: revenue exists at a meaningful level for a company of its size, but gross profit has remained very thin, leaving little room to absorb selling, administrative, and financing costs. That has translated into repeated net losses rather than durable earnings generation.
The business mix highlights the core issue clearly: most of the money brought in by sales is consumed by product costs, and the remaining gross profit has not been sufficient to cover overhead and interest. There was some improvement in net losses in 2025 versus 2024, but the structure still looks fragile because margins remain narrow.
Key Figures
| Metric | Value | Sector ⓘ |
|---|---|---|
| Date | Oct 31, 2026 | |
| Context | ||
| Sector | Consumer Cyclical | |
| Industry | Department Stores | |
| Market Cap ⓘ | $2.02B | |
| Beta ⓘ | -1.29 | |
Value (Cheapness) | ||
| P/E Ratio ⓘ | N/A | 17.02 |
| P/B Ratio ⓘ | 31.90 | 1.61 |
| FCF Yield ⓘ | N/A | 8.71% |
| Dividend Yield ⓘ | N/A | 2.66% |
| EBIT / EV ⓘ | N/A | 6.51% |
| PEG ⓘ | N/A | |
Growth (Business expansion) | ||
| Revenue Growth ⓘ | -34.60% | 5.50% |
| RPS Growth (5Y CAGR) ⓘ | -10.65% | 9.01% |
| EPS Growth (5Y CAGR) ⓘ | N/A | -16.46% |
| BVPS Growth (5Y CAGR) ⓘ | N/A | 5.64% |
| Margin Growth (5Y Trend) ⓘ | N/A | -0.17% |
| FCF Growth (5Y CAGR) ⓘ | -16.15% | 5.33% |
| DPS Growth (5Y CAGR) ⓘ | N/A | 10.21% |
Quality (Business durability) | ||
| ROIC (Latest) ⓘ | N/A | 12.02% |
| ROA (Latest) ⓘ | -2.72% | 5.51% |
| ROIC (5Y Median) ⓘ | N/A | 10.72% |
| ROA (5Y Median) ⓘ | -34.20% | 5.44% |
| Net Debt / EBIT (Latest) ⓘ | N/A | 2.17 |
| Net Debt / EBIT (5Y Median) ⓘ | N/A | 2.30 |
| Net Debt / EBITDA (Latest) ⓘ | N/A | 1.49 |
| Net Debt / Assets ⓘ | 13.47% | 21.53% |
| EBITDA / Interest ⓘ | N/A | 9.26 |
| Operating Margin (Latest) ⓘ | N/A | 9.01% |
| Operating Margin (5Y Median) ⓘ | -27.86% | 9.56% |
| Debt to Equity (Latest) ⓘ | -9.01% | 75.88% |
| Profit Margin (Latest) ⓘ | -9.41% | 5.30% |
| Free Cash Flow (Latest) ⓘ | N/A | |
Momentum (Price trend) | ||
| 3Y Return ⓘ | N/A | +22.25% |
| 12M Return (excl. last month) ⓘ | -36.85% | -4.14% |
| 6M Return ⓘ | -17.29% | -0.38% |
| Price vs. 200-Day MA ⓘ | -25.02% | -1.19% |
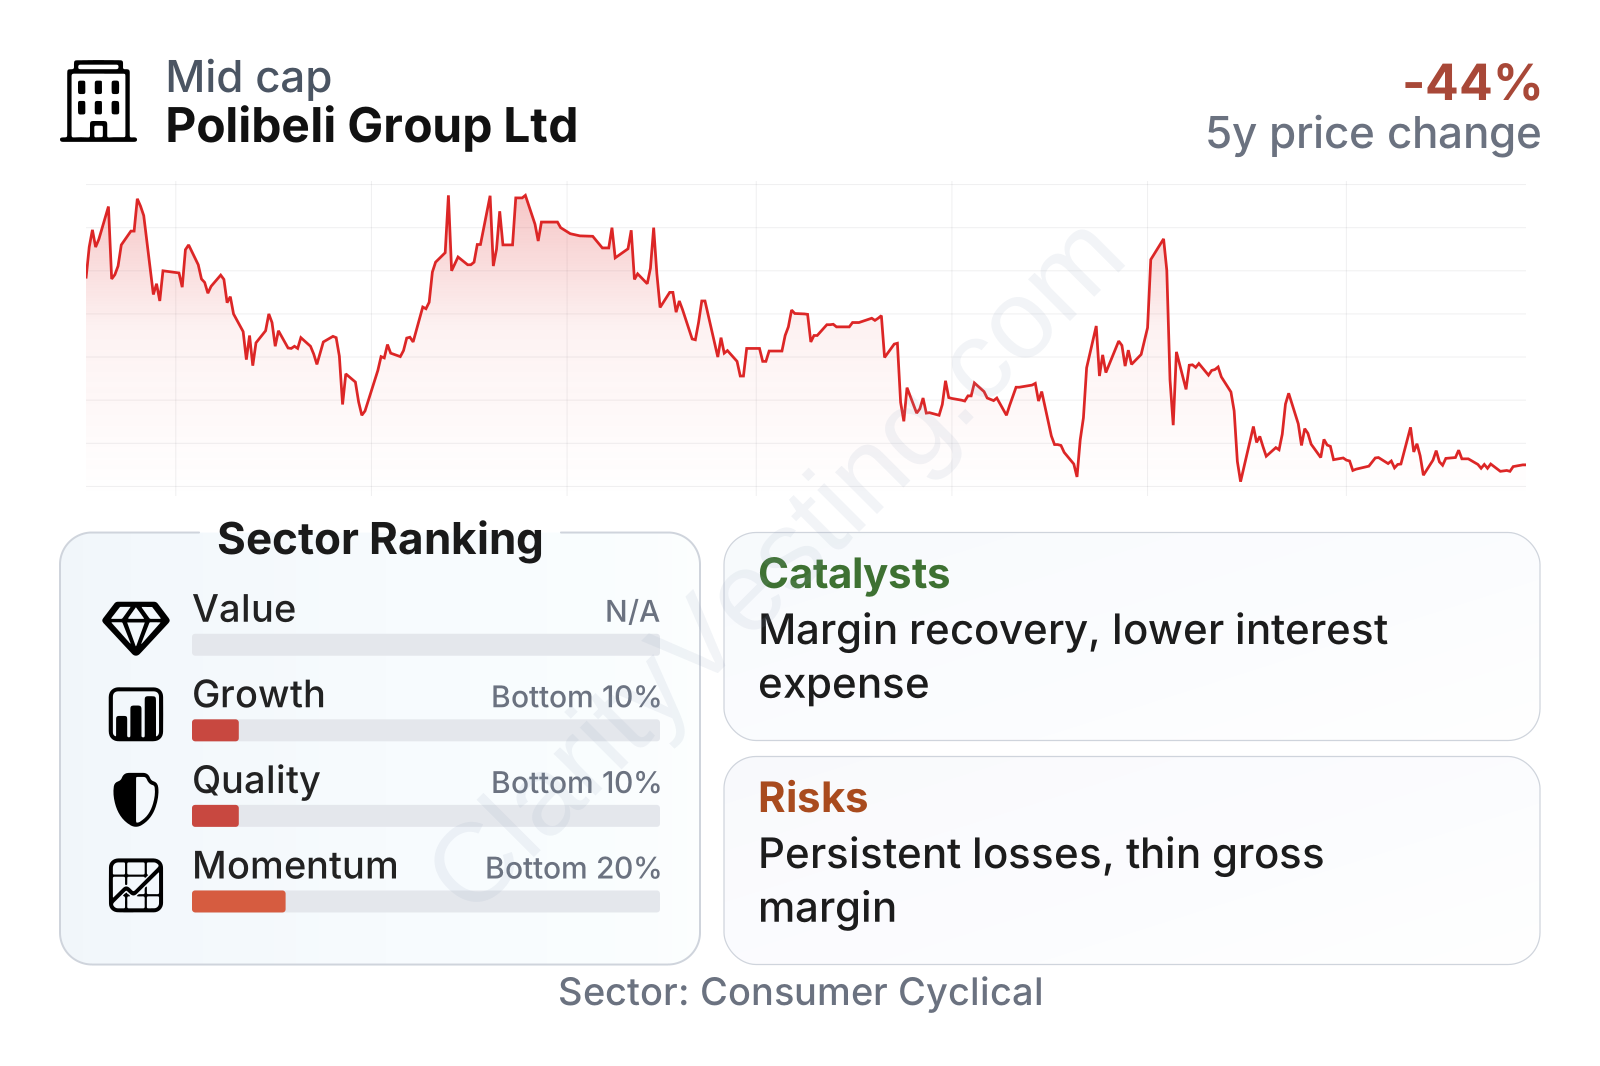
The broad picture is weak across most fundamental categories. Growth and quality both rank near the bottom of the sector, reflecting shrinking revenue, negative profitability, and poor multi-year operating performance. Momentum is also weak, with the share price materially below its longer-term average and down sharply over the past year. One notable offset is balance-sheet leverage relative to assets, which looks lighter than the sector median, but that does not cancel out the core issue: the company is still losing money and generating returns well below industry norms.
Valuation signals are difficult to read in a conventional way. The price-to-book ratio stands far above the sector median, which is unusual for a company with negative margins and weak growth. When a stock looks expensive on book value while operating performance remains poor, it usually means the market is pricing in a recovery that has not yet shown up clearly in the income statement.
Growth
Polibeli operates in a large consumer market, and retail distribution can offer long-term room for expansion when scale, sourcing, logistics, and brand positioning improve. In that sense, the sector itself is not structurally obsolete. Consumer spending, urbanization, and digital commerce can all support demand over time. The challenge is that being in a potentially attractive sector does not automatically create growth at the company level.
So far, Polibeli’s recent operating history does not show strong execution. Revenue contracted sharply on a year-over-year basis, and the five-year trend in revenue per share and free cash flow has also been negative. That suggests the company has not yet translated market opportunity into stable business expansion. For long-term analysis, this matters more than headline industry potential.
The strategy could still make sense if management succeeds in raising gross margin, controlling administrative costs, and reducing financing pressure. Those are the main levers that could change the earnings profile. The latest annual pattern offers one modest positive sign: net losses in 2025 were lower than in 2024, and interest expense also came down from the unusually high 2024 level. That points to some operating stabilization, even if it falls short of a full turnaround.
The most important catalyst is therefore not a new product cycle or a major technological breakthrough, but a basic retail recovery formula: better cost discipline, improved purchasing efficiency, and enough sales consistency to lift margins. If that happens, a business currently producing losses could look very different because its gross profit base is so thin that even modest operating improvements would have a visible effect.
Risks
This article is for informational purposes only and does not constitute financial advice. Some content is AI-generated. See Disclaimer


