Stock Analysis · Piper Sandler Companies (PIPR)
Overview
Piper Sandler Companies is a U.S. investment bank and institutional securities firm. Its work is centered on advising companies, investors, and financial sponsors on transactions and capital raising, while also providing equity research, sales and trading, and selected asset management activities. In simple terms, the company makes money when clients need strategic advice on mergers, acquisitions, financings, and when institutional investors use its market and research platform.
The business is organized mainly into two reportable segments: Advisory Services and Institutional Brokerage. Advisory Services includes merger and acquisition advice, financings, restructuring, and related strategic work. Institutional Brokerage includes equity and fixed income sales and trading, research, and services for institutional clients. A smaller contribution also comes from interest and investment income as well as certain support and corporate items.
Based on recent annual disclosures, Piper Sandler’s revenue mix is led by advisory activity, with institutional brokerage as the second-largest source. Exact percentages can move meaningfully from year to year because transaction activity is cyclical, but a practical breakdown is:
- Advisory services: approximately 55% to 65% of net revenues. This includes M&A advice, public finance and debt advisory, restructuring, and capital advisory assignments.
- Institutional brokerage: approximately 30% to 40% of net revenues. This includes equities and fixed income brokerage, market making, sales and trading, and equity research.
- Other revenue sources: generally below 10%. This includes interest income, investment gains or losses, and smaller ancillary items.
Piper Sandler is not the largest Wall Street firm, but it has built a strong position in mid-cap investment banking and in sector-focused advisory, especially in healthcare, energy, financial services, and other specialized verticals. That narrower focus matters because clients often choose advisers based on expertise and relationships rather than sheer balance-sheet size.
The company’s earnings profile is highly tied to revenue volume rather than product costs, which is typical for an advisory-led firm. Revenue fell sharply in the weak deal market of 2022 and 2023, then recovered in 2024 and 2025, while selling and administrative costs remained the largest expense line. That pattern shows both the operating leverage of the model and its dependence on transaction activity.
Key Figures
| Metric | Value | Sector ⓘ |
|---|---|---|
| Date | Nov 21, 2026 | |
| Context | ||
| Sector | Financial Services | |
| Industry | Capital Markets | |
| Market Cap ⓘ | $4.50B | |
| Beta ⓘ | 1.40 | |
Value (Cheapness) | ||
| P/E Ratio ⓘ | 15.07 | 12.01 |
| P/B Ratio ⓘ | 3.68 | 1.48 |
| FCF Yield ⓘ | 17.56% | 8.77% |
| Dividend Yield ⓘ | 1.13% | 3.01% |
| EBIT / EV ⓘ | 12.15% | 8.31% |
| PEG ⓘ | 1.26 | |
Growth (Business expansion) | ||
| Revenue Growth ⓘ | -7.60% | 6.70% |
| RPS Growth (5Y CAGR) ⓘ | -2.18% | 12.35% |
| EPS Growth (5Y CAGR) ⓘ | 4.70% | -0.27% |
| BVPS Growth (5Y CAGR) ⓘ | 5.34% | 4.83% |
| Margin Growth (5Y Trend) ⓘ | -2.03% | -4.16% |
| FCF Growth (5Y CAGR) ⓘ | -5.31% | 4.69% |
| DPS Growth (5Y CAGR) ⓘ | 2.30% | 8.82% |
Quality (Business durability) | ||
| ROIC (Latest) ⓘ | 26.94% | 9.49% |
| ROE (Latest) ⓘ | 25.61% | 14.02% |
| ROA (Latest) ⓘ | 12.04% | 1.53% |
| ROIC (5Y Median) ⓘ | 13.15% | 7.80% |
| ROE (5Y Median) ⓘ | 18.95% | 12.09% |
| ROA (5Y Median) ⓘ | 8.24% | 1.28% |
| Net Debt / EBIT (Latest) ⓘ | -0.27 | 0.88 |
| Net Debt / EBIT (5Y Median) ⓘ | -1.76 | 0.73 |
| Net Debt / EBITDA (Latest) ⓘ | -0.86 | 0.71 |
| Operating Margin (Latest) ⓘ | 23.18% | 23.37% |
| Operating Margin (5Y Median) ⓘ | 14.74% | 24.29% |
| Debt to Equity (Latest) ⓘ | 12.92% | 59.34% |
| Profit Margin (Latest) ⓘ | 14.55% | 26.65% |
| Free Cash Flow (Latest) ⓘ | $790.18M | |
Momentum (Price trend) | ||
| 3Y Return ⓘ | +66.94% | +73.29% |
| 12M Return (excl. last month) ⓘ | -20.59% | +18.35% |
| 6M Return ⓘ | -24.98% | +3.24% |
| Price vs. 200-Day MA ⓘ | -19.63% | +2.17% |
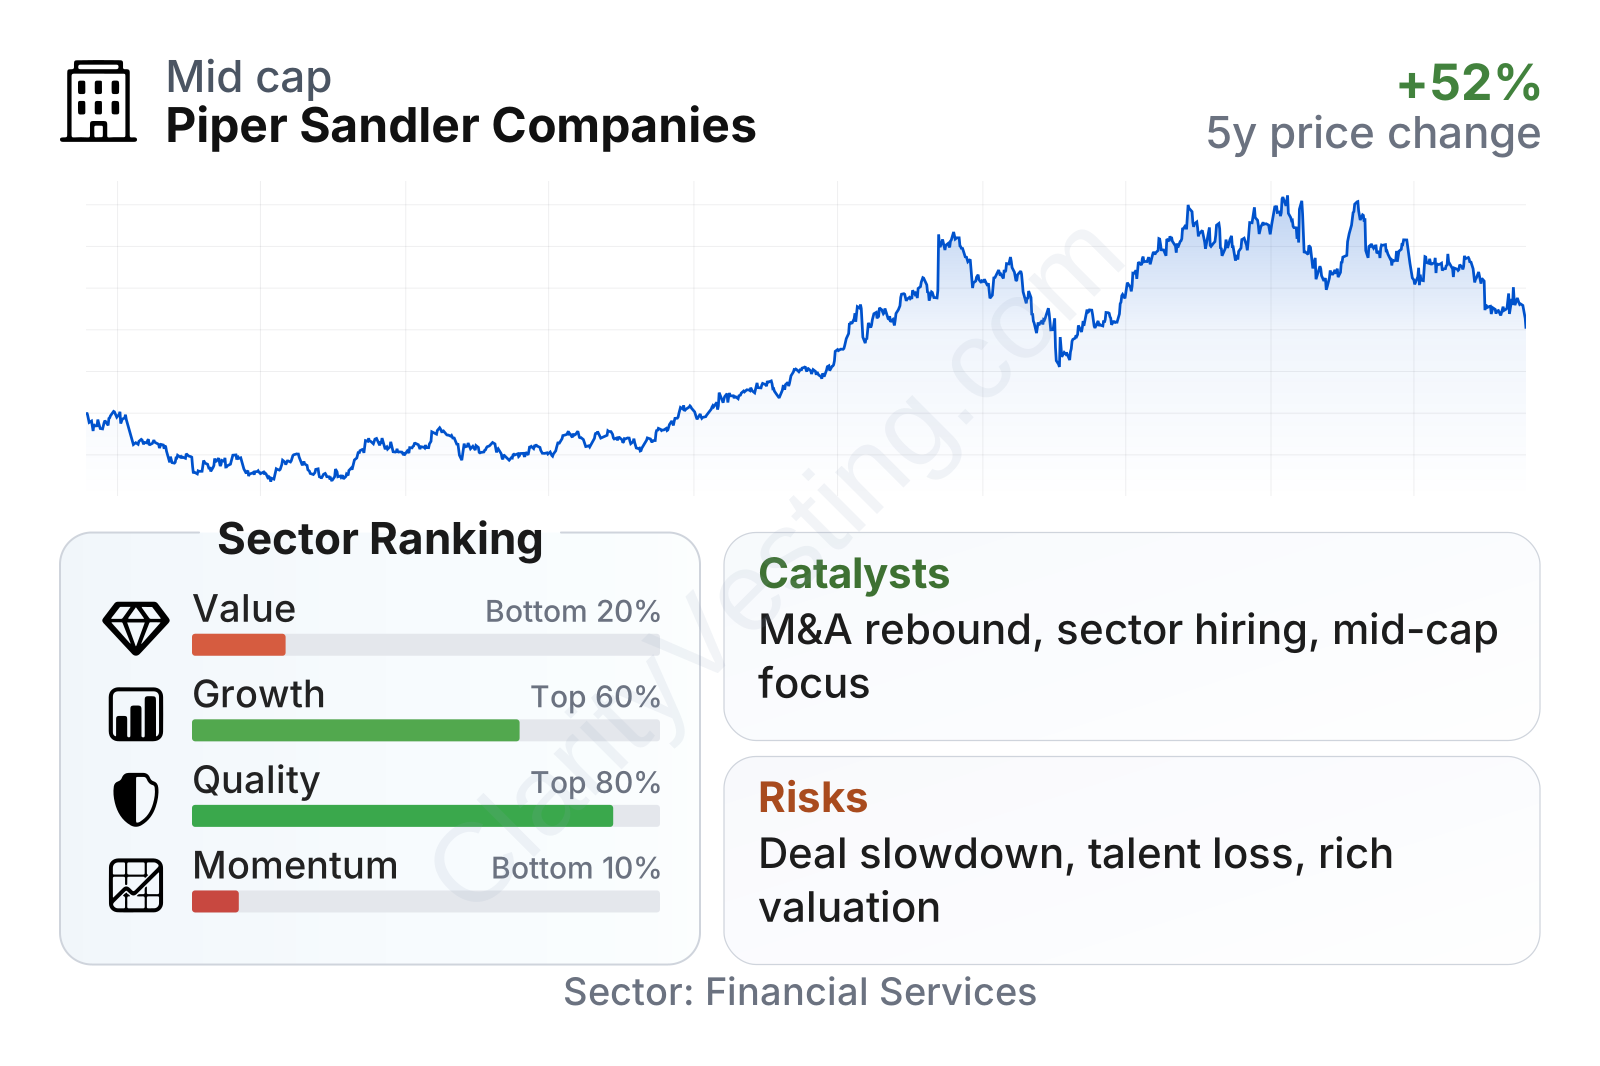
Piper Sandler sits in the mid-sized range within capital markets. The table points to a mixed profile: quality is strong, growth is acceptable but uneven, value metrics look demanding relative to the broader financial sector, and recent momentum has been weak. Profitability stands out, with returns on capital, equity, and assets well above sector medians, while leverage remains conservative with low debt and net cash characteristics. The main tension is that the market already assigns a premium multiple to that quality even though revenue growth has been inconsistent.
The stock’s longer-term share-price trend has been constructive despite pronounced swings, which fits the company’s cyclical business model. Recent weakness versus the sector suggests the market has become more cautious on near-term deal activity or on how sustainable the recent earnings rebound will be.
Growth
Piper Sandler operates in a sector that can grow over time, but not in a straight line. Investment banking and institutional brokerage benefit from long-term drivers such as continued mergers and acquisitions, private-equity exits, healthcare and technology financing needs, and capital market activity from middle-market companies. These are real structural supports, yet the timing of revenue can be volatile because it depends on confidence, interest rates, equity issuance windows, and credit conditions.
The company’s strategy is sensible for that environment. Rather than trying to compete head-on with the very largest global banks, Piper Sandler has focused on specialist verticals, relationship-driven advisory, and selective acquisitions of teams and boutique firms. That model can work well because expertise in attractive niches often carries strong pricing power and repeat business. It also helps the company avoid some of the balance-sheet intensity of larger universal banks.
Earnings per share show the cyclical pattern clearly: a strong period in 2021, a sharp drop during the industry slowdown in 2022 and 2023, and then a recovery through 2024 and 2025 with continued progress into 2026. Over five years, EPS growth has still been positive, which suggests the company has been able to come out of the downturn with stronger earning power rather than merely returning to a flat baseline.
Book value per share has also moved higher over time, including a stronger step-up after 2023. For a financial company, rising book value is an important sign that earnings are not only cyclical but are also adding to the company’s underlying capital base. That supports future flexibility for acquisitions, compensation, dividends, and repurchases.
A meaningful catalyst is any sustained reopening in M&A and equity issuance. Piper Sandler’s advisory-heavy mix gives it substantial upside when clients regain confidence and transaction pipelines convert into completed deals. Recent company communications have also highlighted strategic hiring and franchise expansion in targeted sectors, which can raise market share even without a full industry boom. If healthcare, sponsor-backed deals, and middle-market financing continue to normalize, the company is positioned to participate disproportionately because these are areas where it already has established coverage and relationships.
Risks
This article is for informational purposes only and does not constitute financial advice. Some content is AI-generated. See Disclaimer