Stock Analysis · P3 Health Partners Inc (PIII)
Overview
P3 Health Partners Inc is a healthcare company focused on managing care for people enrolled in Medicare Advantage plans. Its model is built around value-based care, which means it works with physicians and health plans to improve patient outcomes while managing the total cost of care. Rather than simply billing for each visit or procedure, the company is paid based on the health needs of its member population and its ability to coordinate treatment effectively.
The business operates through physician-led care networks and care management programs, with a strong emphasis on seniors and patients with chronic conditions. P3 Health Partners does not look like a traditional hospital or drug company. It is closer to a care coordination platform that combines local physician relationships, analytics, and population health management.
Revenue is heavily concentrated in healthcare service and premium-related arrangements tied to Medicare Advantage members. Based on recent annual reporting, the mix is dominated by one core stream:
- Capitated revenue and other payer payments: approximately 95% to 99% — recurring payments from health plan partners for managing the care of aligned members under risk-sharing or fixed-per-member arrangements.
- Fee-for-service and other patient service revenue: approximately 1% to 5% — smaller amounts linked to clinical services, physician activity, and other healthcare-related services not covered under the main value-based contracts.
This concentration matters because the company’s economics depend far more on medical cost control, member growth, and contract execution than on one-time procedures or product sales.
The overall picture has been mixed: revenue expanded strongly from 2022 through 2024, but profitability did not follow. Operating losses narrowed sharply in 2023 from an unusually weak 2022, then widened again in 2024, while interest expense also increased. That pattern suggests the top line has scale, but the model still needs tighter medical cost performance and expense discipline to turn that scale into durable earnings.
Key Figures
| Metric | Value | Sector ⓘ |
|---|---|---|
| Date | Oct 17, 2026 | |
| Context | ||
| Sector | Healthcare | |
| Industry | Medical Care Facilities | |
| Market Cap ⓘ | $1.15B | |
| Beta ⓘ | 1.69 | |
Value (Cheapness) | ||
| P/E Ratio ⓘ | N/A | 24.79 |
| P/B Ratio ⓘ | 2.65 | 3.08 |
| FCF Yield ⓘ | -11.37% | 3.15% |
| Dividend Yield ⓘ | N/A | 1.94% |
| EBIT / EV ⓘ | -55.11% | 0.57% |
| PEG ⓘ | N/A | |
Growth (Business expansion) | ||
| Revenue Growth ⓘ | 8.60% | 7.45% |
| RPS Growth (5Y CAGR) ⓘ | -6.40% | 8.61% |
| EPS Growth (5Y CAGR) ⓘ | N/A | -17.81% |
| BVPS Growth (5Y CAGR) ⓘ | N/A | 3.72% |
| Margin Growth (5Y Trend) ⓘ | N/A | -0.62% |
| FCF Growth (5Y CAGR) ⓘ | N/A | 1.04% |
| DPS Growth (5Y CAGR) ⓘ | N/A | 6.77% |
Quality (Business durability) | ||
| ROIC (Latest) ⓘ | -112.14% | 3.24% |
| ROA (Latest) ⓘ | -14.71% | 3.01% |
| ROIC (5Y Median) ⓘ | -105.47% | 4.60% |
| ROA (5Y Median) ⓘ | -16.60% | 1.89% |
| Net Debt / EBIT (Latest) ⓘ | N/A | 1.34 |
| Net Debt / EBIT (5Y Median) ⓘ | N/A | 1.84 |
| Net Debt / EBITDA (Latest) ⓘ | N/A | 1.00 |
| Net Debt / Assets ⓘ | 16.66% | 5.45% |
| EBITDA / Interest ⓘ | N/A | 9.64 |
| Operating Margin (Latest) ⓘ | -11.08% | 9.27% |
| Operating Margin (5Y Median) ⓘ | -18.57% | 7.38% |
| Debt to Equity (Latest) ⓘ | 180.46% | 28.58% |
| Profit Margin (Latest) ⓘ | -6.55% | 3.59% |
| Free Cash Flow (Latest) ⓘ | -$130.40M | |
Momentum (Price trend) | ||
| 3Y Return ⓘ | -93.97% | +42.80% |
| 12M Return (excl. last month) ⓘ | +2.27% | +18.50% |
| 6M Return ⓘ | +93.09% | +7.57% |
| Price vs. 200-Day MA ⓘ | -18.18% | +5.12% |
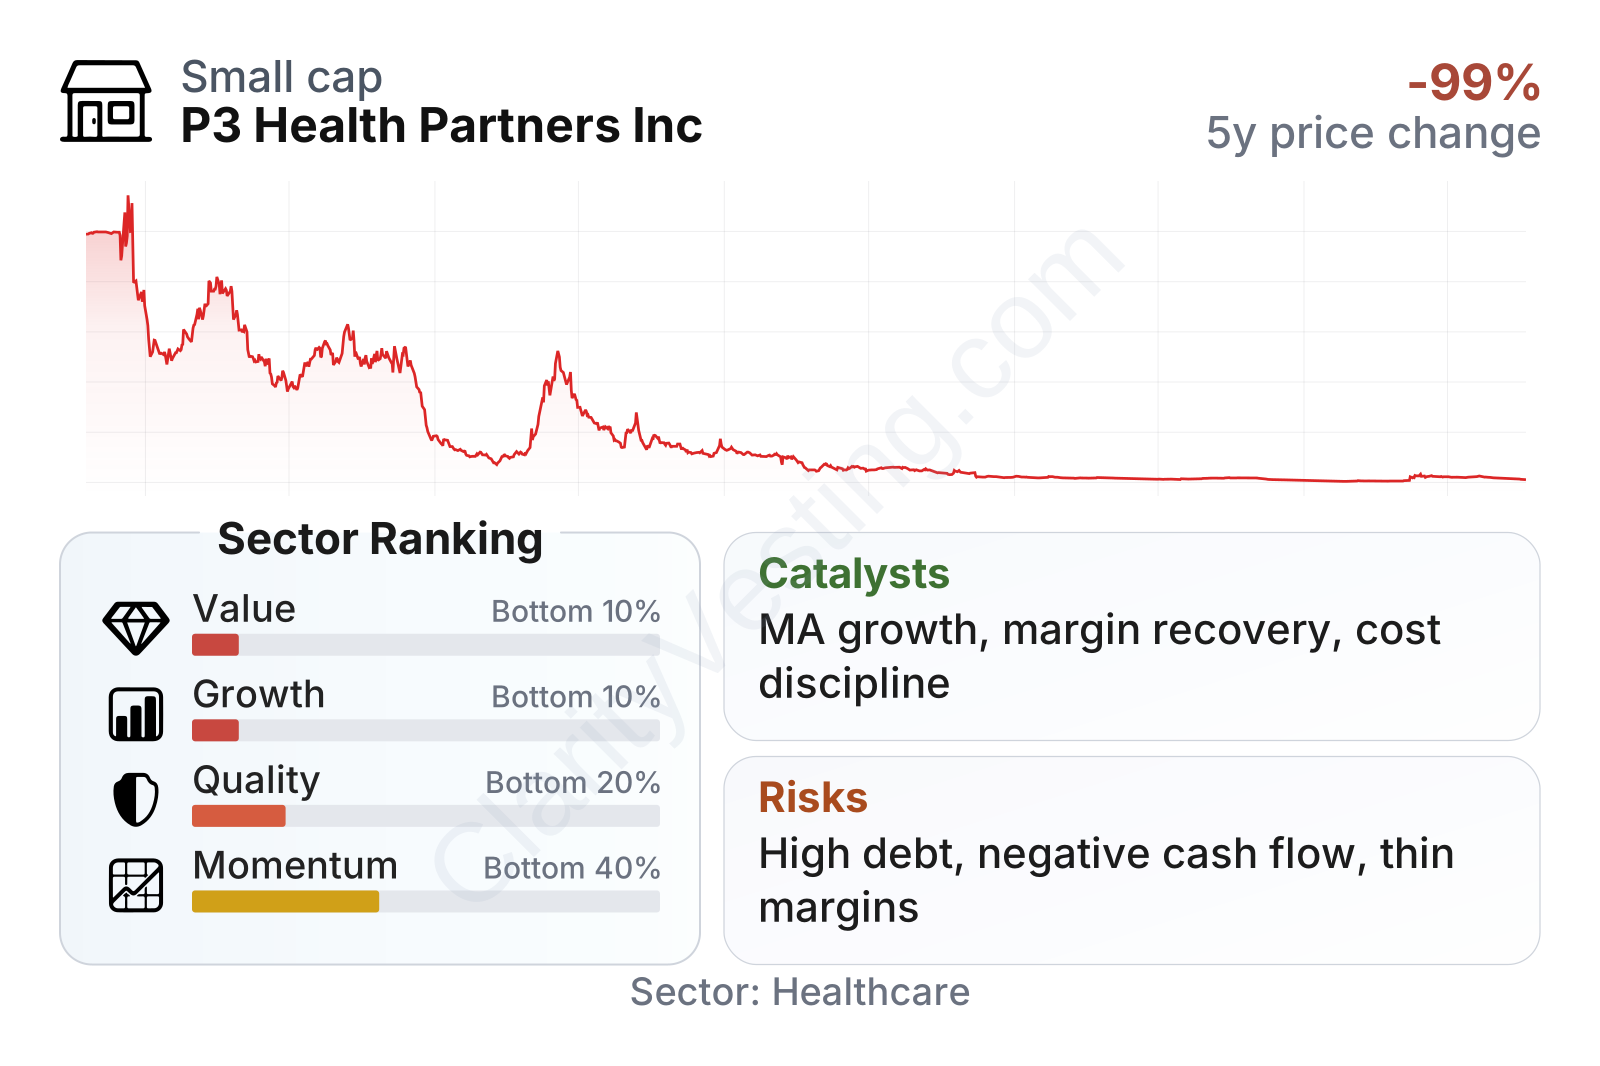
P3 Health Partners is a small-cap healthcare company with above-average share price volatility, reflected in a beta well above 1. On relative measures, it ranks near the bottom of the healthcare sector in value and growth, and below average in quality and momentum. The main reason is not revenue weakness alone, but the combination of ongoing losses, negative free cash flow, and weak returns on capital. Even after a sharp rebound over the last six months, the longer stock history still shows a severe decline from earlier levels, which signals a business that the market continues to view as high risk.
Growth
P3 Health Partners operates in a part of healthcare that still has structural growth behind it. Medicare Advantage enrollment has expanded for years as the U.S. population ages, and value-based care remains attractive to payers and providers because it aims to improve outcomes while reducing unnecessary spending. In that context, the company is positioned in a market with room to grow if it can execute well.
Its strategy is logical on paper. The company focuses on physician alignment, local market density, and care coordination for seniors with complex needs. That can create a scalable model because each added member contributes recurring revenue, while better management of chronic care can improve margins over time. The challenge is that this model only becomes attractive when medical costs are controlled consistently; revenue growth by itself is not enough.
Recent revenue growth has slowed meaningfully from the very high rates seen earlier in the company’s public history. After strong expansion in 2022 through 2024, growth turned negative for several quarters in 2025 before returning to low- to mid-single-digit growth in early 2026 and improving to the high-single-digit range more recently. That is still slightly ahead of the sector median on the latest reading, but it is no longer the kind of growth rate that can easily offset operational missteps.
Cash generation remains an important checkpoint. Free cash flow has stayed negative, although the recent trend appears less severe than the weakest periods. That suggests some operational stabilization, but not a full turnaround. For a long-term business case to strengthen, improvement in cash burn would need to continue and eventually move toward sustainable positive territory.
A meaningful catalyst is the company’s ability to improve performance inside existing markets rather than relying only on expansion. If P3 Health Partners can show better medical cost management, improved member retention, and steadier margins in Medicare Advantage contracts, even moderate revenue growth could have a stronger effect on earnings than in the past. Recent company communications have also centered on operational discipline, balance sheet actions, and market focus, which points to a more selective growth approach rather than expansion at any cost.
Risks
This article is for informational purposes only and does not constitute financial advice. Some content is AI-generated. See Disclaimer


