Stock Analysis · Partners Group (PGPHF)
Overview
Partners Group is a Swiss private-markets investment manager. In simple terms, it manages money for large institutions and wealthy clients and invests that capital in assets that are usually not listed on public stock exchanges. Its main activities are private equity, private debt, infrastructure, and real estate. The firm earns fees for managing these investments over long periods, and it can also earn performance-related income when investments are realized at attractive returns.
This business model is different from a traditional bank or insurer. Partners Group does not mainly rely on lending from its own balance sheet or underwriting risk. Instead, its core engine is managing client capital across private markets. That gives it a relatively asset-light structure and helps explain why margins and returns on capital are unusually high compared with much of the broader financial sector.
Based on company reporting, revenue is mainly generated from recurring management fees, with a smaller but sometimes meaningful contribution from performance fees and investment income. Private-markets firms can see these shares move from year to year, but the broad mix is usually dominated by management fees.
- Management fees: approximately 75% to 90% of revenue in a typical year. These are recurring fees charged on assets managed for clients across private equity, infrastructure, private debt, real estate, and multi-asset solutions.
- Performance fees: approximately 5% to 20% depending on exits and fund realization activity. These are earned when certain investments or portfolios perform above agreed thresholds.
- Other revenues and investment income: generally a smaller share. This can include income linked to the firm’s balance-sheet investments alongside clients and other operating items.
Within assets under management, private equity has historically been the largest strategy, followed by infrastructure and private debt, with real estate representing a smaller share. That matters because private equity and infrastructure tend to be key fee generators and central to the firm’s brand in institutional private markets.
Looking at the income profile over recent years, the company has remained highly profitable even through weaker fundraising and transaction periods. Revenue and operating profit dipped in 2022, then recovered in 2023 and 2024, and the 2025 figures show a stronger rebound. Costs have risen, but much more slowly than revenue over time, which supports the economics of the model.
Key Figures
| Metric | Value | Sector ⓘ |
|---|---|---|
| Date | Oct 03, 2026 | |
| Context | ||
| Sector | Financial Services | |
| Industry | Asset Management | |
| Market Cap ⓘ | $19.45B | |
| Beta ⓘ | 0.96 | |
Value (Cheapness) | ||
| P/E Ratio ⓘ | 13.72 | 12.60 |
| P/B Ratio ⓘ | 16.54 | 1.23 |
| FCF Yield ⓘ | 11.30% | 10.16% |
| Dividend Yield ⓘ | 6.57% | 2.96% |
| EBIT / EV ⓘ | N/A | 7.77% |
| PEG ⓘ | 2.40 | |
Growth (Business expansion) | ||
| Revenue Growth ⓘ | -7.40% | 9.50% |
| RPS Growth (5Y CAGR) ⓘ | -3.50% | 12.10% |
| EPS Growth (5Y CAGR) ⓘ | -3.58% | -9.45% |
| BVPS Growth (5Y CAGR) ⓘ | -11.60% | 5.01% |
| Margin Growth (5Y Trend) ⓘ | -9.79% | -4.07% |
| FCF Growth (5Y CAGR) ⓘ | 22.68% | 4.96% |
| DPS Growth (5Y CAGR) ⓘ | 5.09% | 8.79% |
Quality (Business durability) | ||
| ROIC (Latest) ⓘ | 55.56% | 9.60% |
| ROE (Latest) ⓘ | 122.91% | 13.84% |
| ROA (Latest) ⓘ | 40.17% | 1.53% |
| ROIC (5Y Median) ⓘ | 28.90% | 7.86% |
| ROE (5Y Median) ⓘ | 46.59% | 12.20% |
| ROA (5Y Median) ⓘ | 21.39% | 1.29% |
| Net Debt / EBIT (Latest) ⓘ | 0.88 | 0.91 |
| Net Debt / EBIT (5Y Median) ⓘ | 0.32 | 0.74 |
| Net Debt / EBITDA (Latest) ⓘ | 0.84 | 0.97 |
| Operating Margin (Latest) ⓘ | 60.23% | 22.12% |
| Operating Margin (5Y Median) ⓘ | 62.92% | 24.39% |
| Debt to Equity (Latest) ⓘ | 192.84% | 60.37% |
| Profit Margin (Latest) ⓘ | 48.04% | 26.62% |
| Free Cash Flow (Latest) ⓘ | $2.20B | |
Momentum (Price trend) | ||
| 3Y Return ⓘ | -20.30% | +89.23% |
| 12M Return (excl. last month) ⓘ | -28.59% | +17.35% |
| 6M Return ⓘ | -21.02% | +10.00% |
| Price vs. 200-Day MA ⓘ | -22.52% | +3.73% |
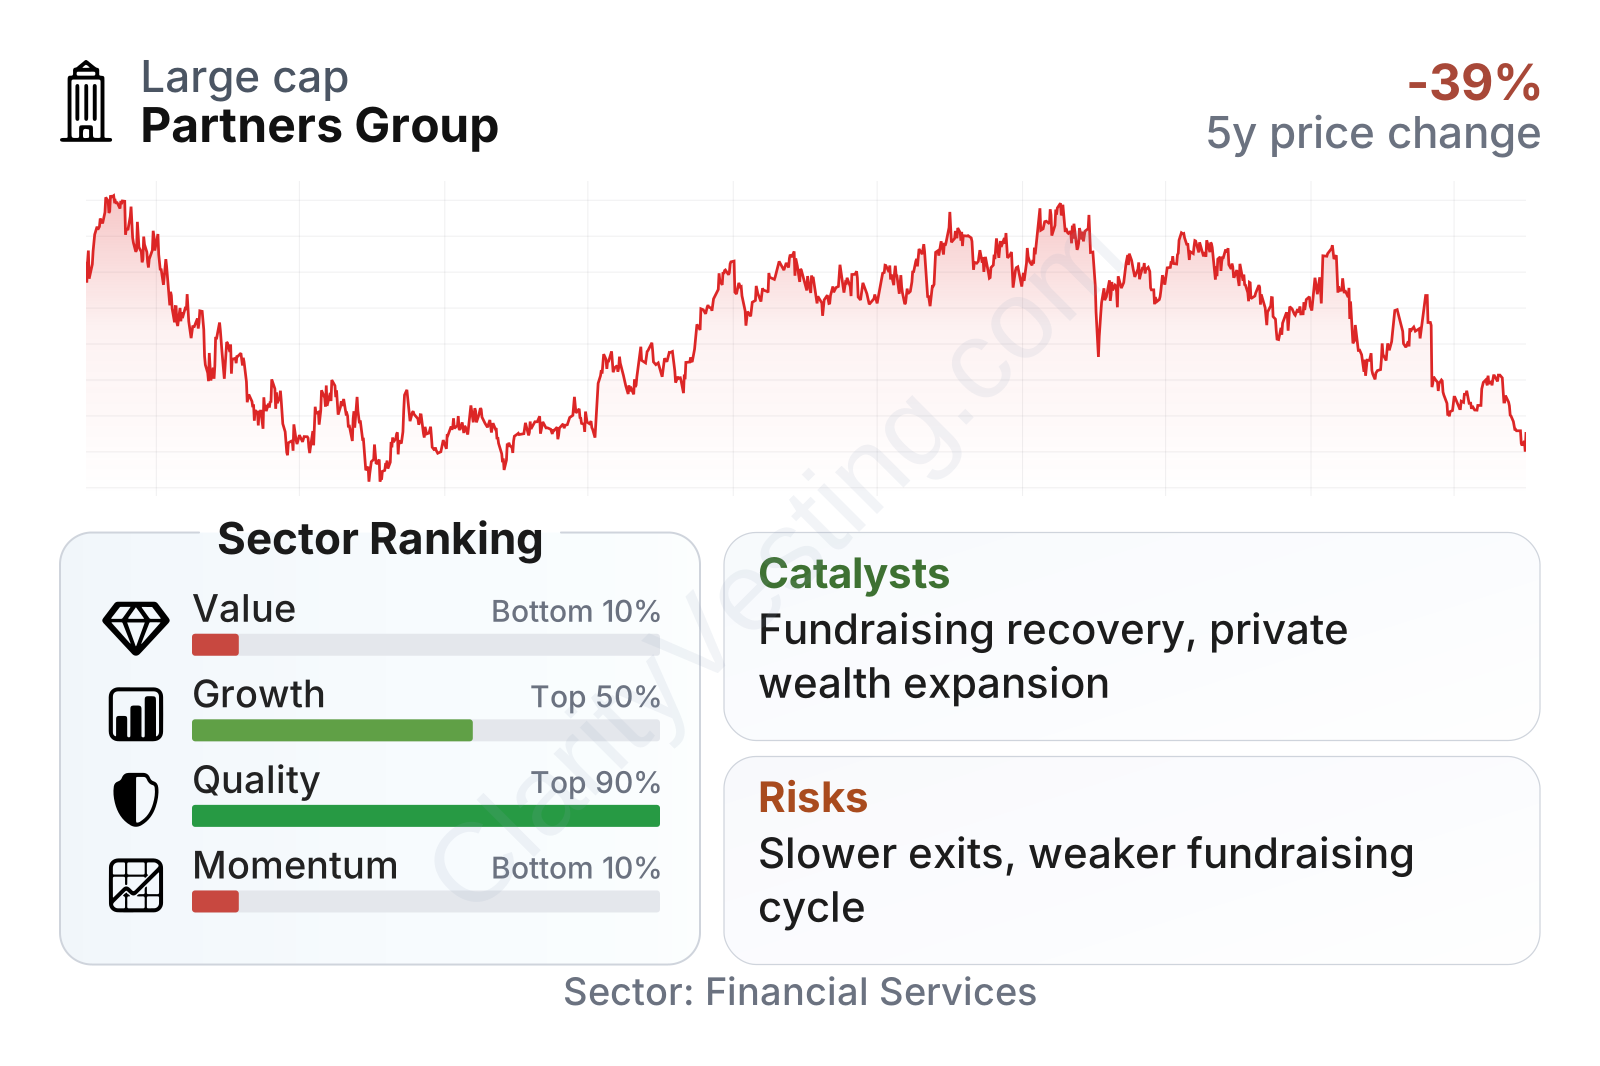
Partners Group is a large listed alternative asset manager with a market value around the upper end of mid-cap to large-cap territory in financial services. The business stands out for exceptional quality metrics: operating margin is around 60%, profit margin is near 48%, and returns on capital, equity, and assets are far above sector medians. Leverage is not excessive relative to earnings, although debt-to-equity appears elevated, which is common to monitor carefully in financial businesses. On valuation, the stock does not look cheap on book value, trading at a very large premium to the sector, while the earnings multiple is closer to the sector median. Growth signals are mixed, with recent revenue pressure and softer multi-year book value trends, but free cash flow generation remains strong. Share-price momentum has been weak, which suggests the market has recently become more cautious on the name.
Growth
Partners Group operates in private markets, a segment that has expanded for many years as pension funds, insurers, sovereign funds, family offices, and affluent investors have looked beyond traditional stocks and bonds. This remains a structurally growing area of finance. Several long-term drivers support the industry: institutions continue to seek diversification, companies increasingly stay private longer, infrastructure requires major investment, and private credit has gained share as banks face tighter capital rules.
The company’s strategy is aligned with those trends. It has built broad capabilities across private equity, infrastructure, private debt, and real estate rather than relying on only one niche. That diversification matters because client demand and realization activity can rotate between strategies. Infrastructure and private credit are especially relevant growth areas today, as energy transition spending, digital infrastructure, and financing needs outside the banking system create a deep opportunity set.
A key catalyst is fundraising recovery. Private-markets firms have faced a tougher environment since interest rates rose and distributions slowed across the industry. If exit activity improves and clients start receiving more cash back from older funds, new commitments can accelerate. For a firm like Partners Group, that can support higher assets under management and a larger base of recurring management fees.
Another positive feature is operating scalability. Once a private-markets platform reaches meaningful size, additional assets can be managed with less than proportional cost growth. That helps explain why the business has maintained strong margins even in uneven markets and why a better fundraising cycle could lift earnings power noticeably.
The earnings path has been somewhat uneven recently, which is normal for this industry because performance fees, realizations, and market conditions can move around from one period to another. Even so, the company’s earnings base remains substantial, and the larger question for long-term analysis is whether fee-earning assets continue compounding over multi-year periods rather than whether one half-year reading is temporarily softer.
Book value per share has moved down over the last several years, which is not an ideal trend on the surface. However, for an asset manager, book value is not the full economic picture because the most valuable assets are often the franchise, distribution network, client relationships, and future fee streams rather than hard balance-sheet assets alone. That is one reason the market has historically valued Partners Group far above book value.
Recent company communications have also emphasized continued client demand for evergreen and private-wealth solutions. That is an important development because it broadens the addressable market beyond large institutions. If execution remains solid, this channel can become a meaningful long-term growth engine alongside the traditional institutional business.
Risks
This article is for informational purposes only and does not constitute financial advice. Some content is AI-generated. See Disclaimer