Stock Analysis · Procter & Gamble Company (PG)
Overview
Procter & Gamble is one of the world’s largest consumer goods companies. It sells everyday products that people tend to keep buying in good economies and weak economies alike, including detergents, diapers, shampoos, razors, toothbrushes, deodorants, and paper products. Its portfolio includes many widely known brands such as Tide, Pampers, Gillette, Head & Shoulders, Oral-B, Always, Charmin, and Olay. That makes the business relatively easy to understand: P&G earns money by selling household and personal care items through retailers, e-commerce platforms, club stores, drugstores, and other channels across the world.
The company reports revenue through five main product segments. Based on the latest annual reporting mix, the largest sources of sales are approximately:
- Fabric & Home Care: about 35% of revenue. This includes laundry care and home care products such as detergents, fabric enhancers, dish care, and surface cleaners.
- Baby, Feminine & Family Care: about 25%. This segment includes diapers, baby wipes, feminine care, and paper products such as tissue and paper towels.
- Beauty: about 18%. This includes hair care, skin care, personal cleansing, and deodorants.
- Health Care: about 15%. This covers oral care, personal health care, and related over-the-counter categories.
- Grooming: about 8%. This segment is mainly shaving products, razors, and appliances.
Geographically, the United States is the largest market, but P&G is highly international, with a substantial share of sales coming from Europe, Greater China, Asia Pacific, Latin America, India, the Middle East, and Africa. That global reach helps diversify demand, although it also exposes results to currency movements and regional consumer weakness.
P&G’s financial profile is typical of a mature consumer staples leader: very large revenue, steady margins, high cash generation, and heavy spending on branding, distribution, and retailer relationships. Over the last few years, sales have grown gradually while profitability has remained strong, showing that the company has been able to offset part of its cost inflation through pricing, productivity programs, and product mix.
The business flow shows a company with durable gross profit and solid net income conversion. Revenue has moved from roughly $80 billion to the high $80 billion range over four years, while net income has stayed resilient and operating profit has improved, reflecting the strength of the brand portfolio and disciplined cost control.
Key Figures
| Metric | Value | Sector ⓘ |
|---|---|---|
| Date | Oct 03, 2026 | |
| Context | ||
| Sector | Consumer Defensive | |
| Industry | Household & Personal Products | |
| Market Cap ⓘ | $346.15B | |
| Beta ⓘ | 0.38 | |
Value (Cheapness) | ||
| P/E Ratio ⓘ | 22.08 | 18.16 |
| P/B Ratio ⓘ | 6.64 | 1.27 |
| FCF Yield ⓘ | 4.38% | 12.39% |
| Dividend Yield ⓘ | 2.91% | 2.83% |
| EBIT / EV ⓘ | 5.74% | 6.45% |
| PEG ⓘ | 3.79 | |
Growth (Business expansion) | ||
| Revenue Growth ⓘ | 1.50% | 3.80% |
| RPS Growth (5Y CAGR) ⓘ | 3.28% | 6.20% |
| EPS Growth (5Y CAGR) ⓘ | 4.35% | -14.64% |
| BVPS Growth (5Y CAGR) ⓘ | 5.66% | 3.26% |
| Margin Growth (5Y Trend) ⓘ | 1.43% | -0.25% |
| FCF Growth (5Y CAGR) ⓘ | 2.79% | 4.65% |
| DPS Growth (5Y CAGR) ⓘ | 5.16% | 6.86% |
Quality (Business durability) | ||
| ROIC (Latest) ⓘ | 18.94% | 12.58% |
| ROA (Latest) ⓘ | 12.63% | 6.35% |
| ROIC (5Y Median) ⓘ | 26.96% | 10.36% |
| ROA (5Y Median) ⓘ | 12.47% | 5.44% |
| Net Debt / EBIT (Latest) ⓘ | 1.18 | 1.91 |
| Net Debt / EBIT (5Y Median) ⓘ | 1.23 | 2.32 |
| Net Debt / EBITDA (Latest) ⓘ | 1.18 | 1.36 |
| Net Debt / Assets ⓘ | 19.83% | 21.25% |
| EBITDA / Interest ⓘ | 16.14 | 9.61 |
| Operating Margin (Latest) ⓘ | 24.42% | 8.96% |
| Operating Margin (5Y Median) ⓘ | 23.42% | 9.53% |
| Debt to Equity (Latest) ⓘ | 64.49% | 71.66% |
| Profit Margin (Latest) ⓘ | 18.44% | 5.40% |
| Free Cash Flow (Latest) ⓘ | $15.15B | |
Momentum (Price trend) | ||
| 3Y Return ⓘ | +10.06% | +15.25% |
| 12M Return (excl. last month) ⓘ | -5.75% | +2.63% |
| 6M Return ⓘ | +4.03% | +2.43% |
| Price vs. 200-Day MA ⓘ | +1.49% | +0.43% |
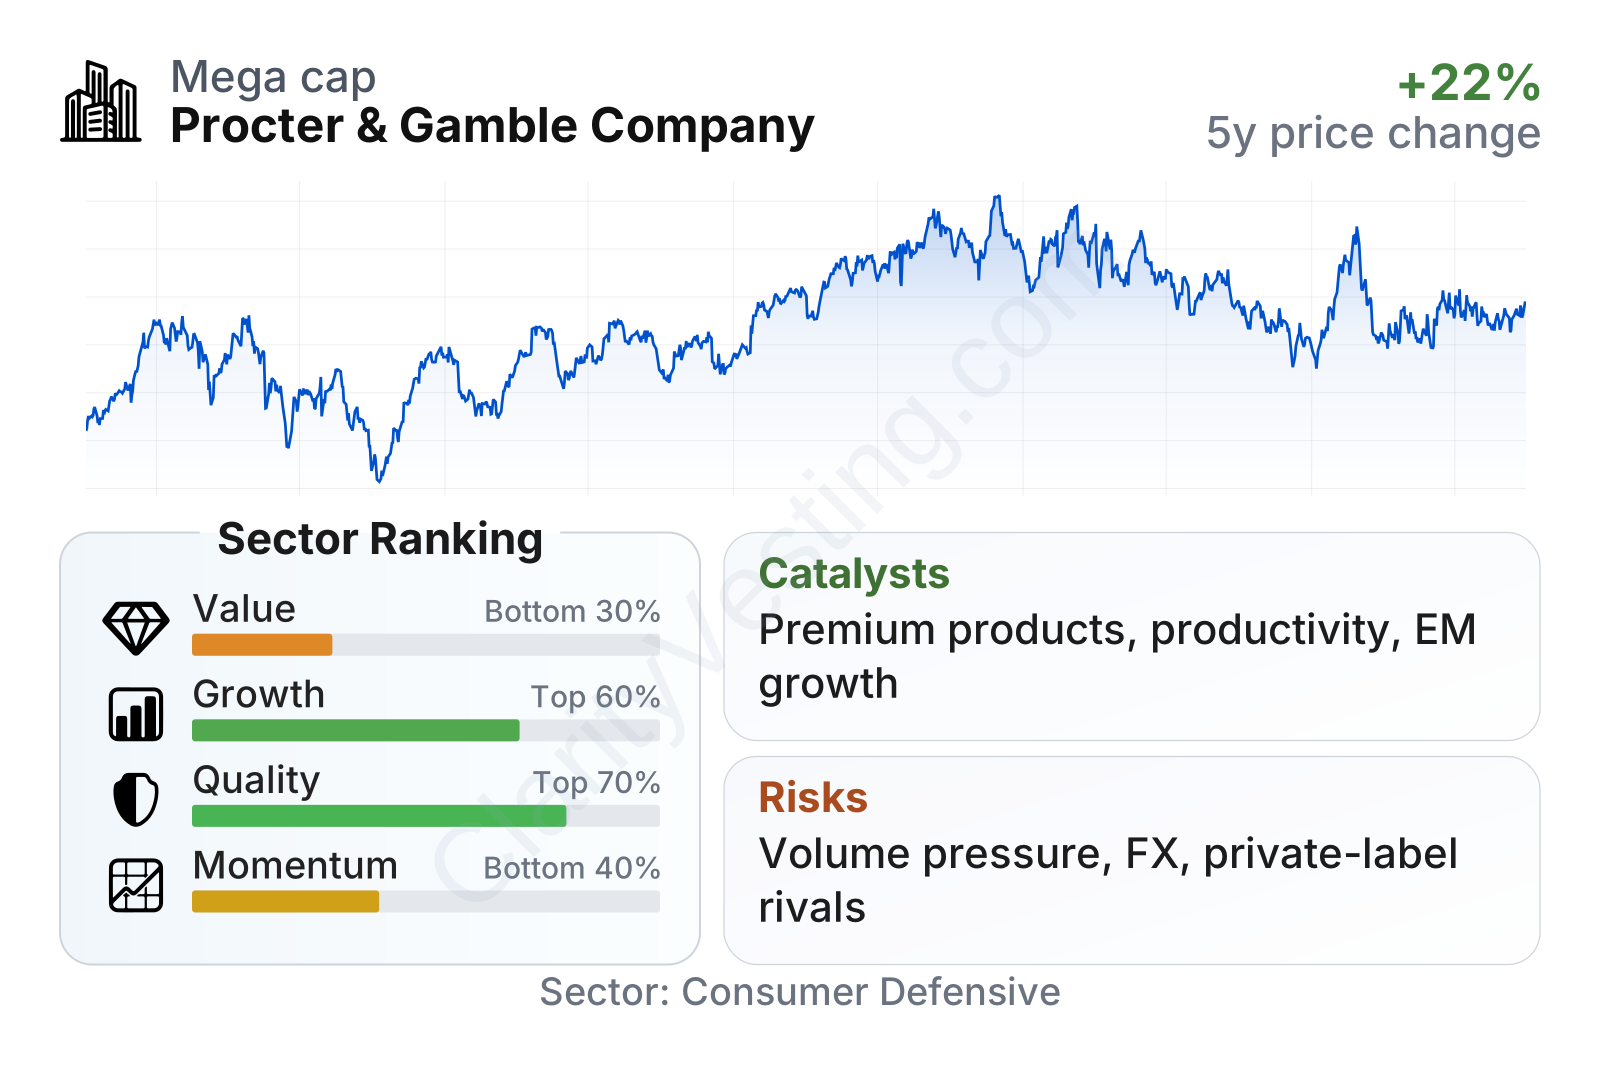
P&G stands out more for business quality than for cheap valuation or fast expansion. Profitability and returns on capital are well above the sector median, while leverage remains manageable and interest coverage is strong. Growth is positive but not especially high for the sector, and the valuation metrics suggest the market continues to place a premium on stability, brand strength, and cash generation.
The share price history also fits that profile. The stock has been less volatile than most equities, which is consistent with its low beta of about 0.38. Recent performance has been more mixed than the long-term defensive reputation might imply, but the business itself has remained financially steady.
Growth
P&G operates in a sector that is not usually associated with rapid expansion, but it is a structurally resilient one. Household and personal care demand tends to be recurring because consumers replace these products regularly. That means long-term growth often comes less from breakthrough disruption and more from a combination of modest volume gains, price increases, premium products, market share improvements, and expansion in underpenetrated international markets.
The company’s strategy is consistent with that reality. P&G focuses on daily-use categories where brand recognition matters, where shelf presence matters, and where consumers often stick with familiar products. Management has spent years simplifying the portfolio around stronger categories and leading brands, while investing in product superiority, packaging improvements, and marketing. For a company in consumer staples, that is a sensible approach because it supports pricing power and retailer relevance rather than chasing low-quality growth.
Revenue growth has not been linear. There were periods of stronger expansion followed by softer or even slightly negative comparisons, which is normal for a mature global staples company dealing with pricing resets, foreign exchange shifts, and changing consumer demand. More recently, growth has returned to a low-single-digit pace, showing that the business is still expanding, but at a measured rate rather than a high-growth rate.
Cash generation remains one of the clearest strengths. Free cash flow has stayed in a very large range over time, even with some year-to-year fluctuation. That matters because it gives the company flexibility to fund capital spending, support brand investment, maintain dividends, and repurchase shares without depending too heavily on new borrowing.
One important catalyst is the continued premiumization of categories such as fabric care, oral care, skin care, and grooming, where consumers may accept higher prices for trusted performance. Another is productivity work across manufacturing and supply chains, which can protect margins even when raw materials, freight, or labor costs are under pressure. International markets also remain relevant, especially where rising incomes can lift demand for branded packaged goods.
Recent company communications have continued to emphasize innovation, productivity, and balanced capital allocation. None of that changes P&G into a fast-growth company, but it reinforces the idea that steady compounding can still come from a mature business when the brand portfolio is unusually strong and execution remains disciplined.
Risks
This article is for informational purposes only and does not constitute financial advice. Some content is AI-generated. See Disclaimer


