Stock Analysis · PennyMac Finl Svcs Inc (PFSI)
Overview
PennyMac Financial Services, Inc. is a U.S. mortgage company. In simple terms, it helps create home loans, services those loans after closing, and supports the flow of mortgages into the broader housing finance system. Its business is built around two main activities: producing mortgages and collecting recurring fees for managing loan payments, escrow balances, and customer support on behalf of mortgage owners and mortgage-backed securities investors.
The company reports through two main operating segments: production and servicing. Production includes originating new mortgage loans through correspondent acquisitions, broker-direct channels, and consumer-direct channels, then selling or securitizing those loans. Servicing includes collecting monthly payments, handling taxes and insurance, managing borrower relationships, and overseeing delinquency or loss-mitigation activities where needed. PennyMac also earns investment income tied to mortgage servicing rights, interest rate management activities, and holdings connected to its mortgage platform.
Based on recent annual results, PennyMac’s revenue mix is heavily shaped by mortgage market conditions, but the broad structure can be summarized as follows:
- Production-related revenue: approximately 55% to 65% of total revenue in stronger origination periods. This includes gains on loan sales, fulfillment income, and revenue tied to acquiring and securitizing mortgage loans.
- Servicing-related revenue: approximately 25% to 35%. This includes contractual servicing fees and changes in the value of mortgage servicing rights, which tend to become more valuable when interest rates stay higher and prepayments slow down.
- Interest income and other investment or management-related revenue: approximately 10% to 20%. This can include interest earned on loans held for sale, custodial balances, and other mortgage-related assets, partly offset by hedging movements depending on the quarter.
This mix matters because PennyMac is not a pure lender. Its large servicing platform can provide a counterweight when mortgage origination volumes weaken, while the production side can benefit sharply when refinancing or home purchase activity improves.
The multi-year revenue path also shows how cyclical this business is. Revenue fell sharply after the unusually strong mortgage environment of 2021, then recovered as the company leaned on servicing and maintained production scale. Profitability has improved from the trough, but interest expense has become a more meaningful drag as funding costs stayed elevated.
The long-term pattern is clear: revenue and net income can swing materially from year to year, yet the business has remained profitable across very different mortgage markets. That resilience is important for understanding the company’s long-term profile.
Key Figures
| Metric | Value | Sector ⓘ |
|---|---|---|
| Date | Oct 24, 2026 | |
| Context | ||
| Sector | Financial Services | |
| Industry | Mortgage Finance | |
| Market Cap ⓘ | $3.09B | |
| Beta ⓘ | 1.45 | |
Value (Cheapness) | ||
| P/E Ratio ⓘ | 8.29 | 12.46 |
| P/B Ratio ⓘ | 0.78 | 1.25 |
| FCF Yield ⓘ | -50.12% | 9.82% |
| Dividend Yield ⓘ | 1.99% | 2.94% |
| EBIT / EV ⓘ | 1.92% | 8.11% |
| PEG ⓘ | 4.67 | |
Growth (Business expansion) | ||
| Revenue Growth ⓘ | 1.80% | 9.10% |
| RPS Growth (5Y CAGR) ⓘ | 11.67% | 12.31% |
| EPS Growth (5Y CAGR) ⓘ | -9.62% | -6.97% |
| BVPS Growth (5Y CAGR) ⓘ | 12.09% | 5.02% |
| Margin Growth (5Y Trend) ⓘ | -25.72% | -4.00% |
| FCF Growth (5Y CAGR) ⓘ | N/A | 4.71% |
| DPS Growth (5Y CAGR) ⓘ | 10.31% | 8.92% |
Quality (Business durability) | ||
| ROIC (Latest) ⓘ | 1.44% | 9.18% |
| ROE (Latest) ⓘ | 9.18% | 13.93% |
| ROA (Latest) ⓘ | 1.42% | 1.57% |
| ROIC (5Y Median) ⓘ | 3.47% | 7.80% |
| ROE (5Y Median) ⓘ | 12.31% | 12.15% |
| ROA (5Y Median) ⓘ | 1.81% | 1.28% |
| Net Debt / EBIT (Latest) ⓘ | 46.36 | 1.02 |
| Net Debt / EBIT (5Y Median) ⓘ | 17.69 | 0.72 |
| Net Debt / EBITDA (Latest) ⓘ | 40.71 | 0.88 |
| Operating Margin (Latest) ⓘ | 10.05% | 22.30% |
| Operating Margin (5Y Median) ⓘ | 29.67% | 24.50% |
| Debt to Equity (Latest) ⓘ | 546.11% | 59.34% |
| Profit Margin (Latest) ⓘ | 11.78% | 26.42% |
| Free Cash Flow (Latest) ⓘ | -$1.55B | |
Momentum (Price trend) | ||
| 3Y Return ⓘ | +3.09% | +95.73% |
| 12M Return (excl. last month) ⓘ | -44.30% | +17.30% |
| 6M Return ⓘ | -29.44% | +6.07% |
| Price vs. 200-Day MA ⓘ | -26.64% | +5.36% |
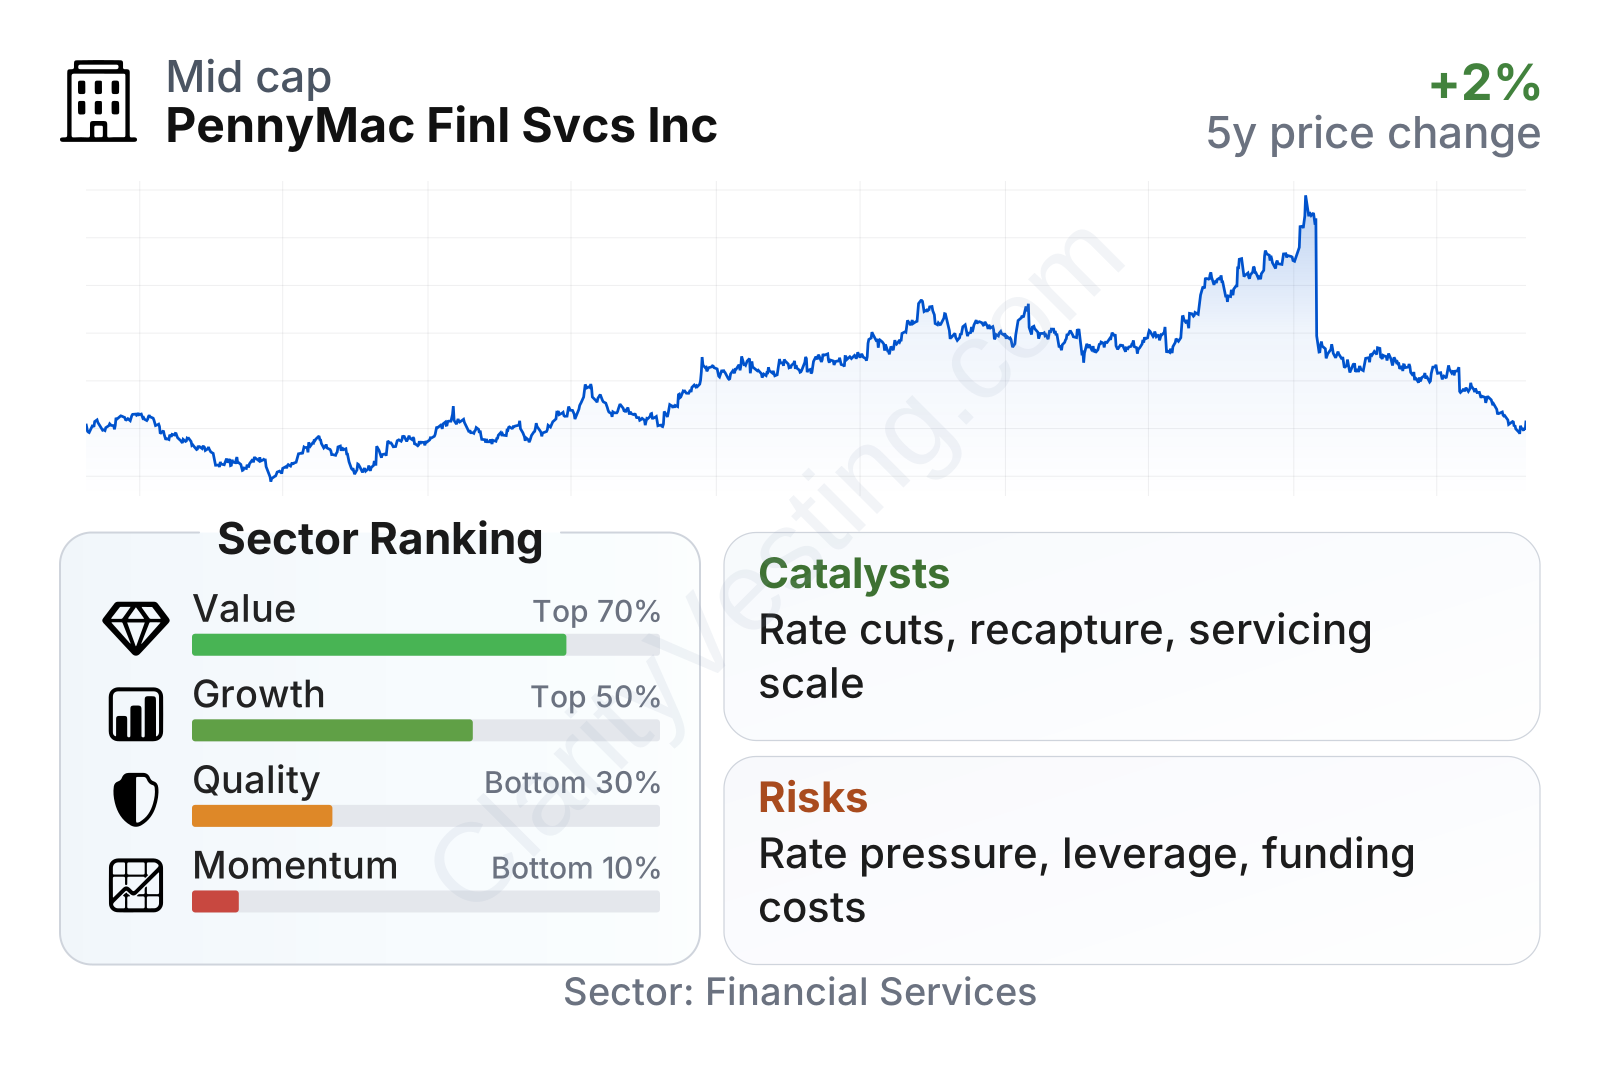
PennyMac currently sits in a mixed position. Valuation metrics are below many sector peers, with earnings and book value multiples under the sector median, while growth metrics are around the middle of the pack. Quality measures are weaker than many financial companies because leverage is high and recent profitability ratios have softened. Price performance has also been notably weak in recent months, which explains the very low momentum ranking. In short, the market is assigning a cautious valuation despite the company remaining profitable and still compounding book value over time.
Growth
PennyMac operates in mortgage finance, a sector that does not grow in a straight line but remains structurally important because U.S. housing turnover, purchase lending, refinancing cycles, and mortgage servicing all persist through economic cycles. The company’s strategy is built for that reality. It combines a large loan production engine with a servicing platform that can benefit when borrowers refinance less frequently. That combination gives PennyMac exposure to both recovery in origination demand and recurring servicing economics.
A central long-term growth driver is scale. PennyMac is one of the larger U.S. mortgage originators and one of the larger mortgage servicers, especially in the correspondent channel where it buys loans from smaller lenders and credit unions. That scale can improve operating efficiency, strengthen relationships with loan sellers, and create more opportunities to recapture borrowers later through refinancing or new home purchase loans. Management has consistently emphasized technology, fulfillment efficiency, and servicing retention as ways to deepen that advantage.
Earnings per share illustrate the cyclical nature of the business. Results were exceptionally strong in 2021, dropped as the mortgage market cooled, and then recovered meaningfully in 2024 and 2025. That rebound suggests the company has been able to adapt rather than simply wait for interest rates to fall. For a long-term view, this matters more than any single year’s peak or trough.
Book value per share has followed a steadier upward path than earnings. Over the last five years, it has compounded at roughly 12% annually, clearly ahead of the sector median. That is a useful sign in a financial company because book value often reflects whether management is preserving and expanding economic value through a volatile cycle.
The strongest catalyst for future growth would be a more favorable mortgage market. If interest rates decline or housing activity improves, origination volumes could recover and gain-on-sale margins may improve. A second catalyst is servicing retention: PennyMac already has a large base of customers whose mortgages it services, which creates a built-in audience for future refinance or purchase activity. A third catalyst is market-share consolidation. Smaller mortgage lenders often struggle when volumes are weak and funding costs are high, which can leave larger and better-capitalized players in a stronger competitive position.
Recent company communications have continued to highlight its scale in servicing and correspondent lending, along with ongoing capital returns through dividends and share repurchases. Those steps do not remove cyclicality, but they do indicate confidence in the durability of the platform.
Risks
This article is for informational purposes only and does not constitute financial advice. Some content is AI-generated. See Disclaimer


