Stock Analysis · Prudential Financial Inc (PFH)
Overview
Prudential Financial is a large U.S.-based financial services group focused on life insurance, retirement products, investment management, and related asset accumulation businesses. Even though the accompanying market classification labels it under real estate, Prudential’s actual operations are those of an insurer and retirement savings provider. Its business serves individuals, employers, institutional clients, and international customers through products designed to protect income, provide retirement income, and manage long-term savings.
The company’s revenue mix can move meaningfully from year to year because insurers are affected by investment gains and losses, interest rates, and market movements. Based on recent annual reporting, the largest recurring business sources generally come from premiums, policy charges and fees, net investment income, and asset management-related fees. At a high level, the business can be understood through these main engines:
- Premiums: roughly 25% to 35% of total revenue in a typical year, generated from life insurance and related protection products.
- Net investment income: roughly 30% to 45%, reflecting returns earned on the large investment portfolio that supports policy liabilities.
- Policy charges and fee income: roughly 15% to 25%, coming from retirement, annuity, and insurance account fees.
- Asset management and other fees: usually a smaller but important share, tied to managing third-party and affiliated assets.
- Realized investment gains, losses, and other items: a volatile portion that can materially affect reported revenue and earnings from one year to the next.
That structure makes Prudential different from a simple consumer brand or industrial company. Results depend not only on customer demand, but also on spreads between investment returns and policy obligations, mortality and longevity trends, retirement flows, and the value of assets under management.
The long-term picture from the income flow is uneven but improving. Revenue and profit fell sharply in 2022, then recovered in 2023 through 2025. By 2025, operating income and net income were notably stronger than in the prior two years, while costs stayed comparatively controlled relative to revenue. That pattern suggests a business that can recover earnings power after market stress, but it also highlights how cyclical and accounting-sensitive insurance results can be.
The operating picture shows a sharp disruption in 2022 followed by a recovery in revenue and earnings. More recent years indicate better profitability than the trough period, which matters because Prudential’s valuation depends heavily on whether this rebound proves durable rather than temporary.
Key Figures
| Metric | Value | Sector ⓘ |
|---|---|---|
| Date | Oct 24, 2026 | |
| Context | ||
| Sector | Real Estate | |
| Industry | REIT - Residential | |
| Market Cap ⓘ | $45.49B | |
| Beta ⓘ | N/A | |
Value (Cheapness) | ||
| P/E Ratio ⓘ | N/A | 17.85 |
| P/B Ratio ⓘ | 0.15 | 0.87 |
| FCF Yield ⓘ | 24.11% | 7.30% |
| Dividend Yield ⓘ | N/A | 4.83% |
| EBIT / EV ⓘ | N/A | 3.78% |
| PEG ⓘ | N/A | |
Growth (Business expansion) | ||
| Revenue Growth ⓘ | N/A | 5.35% |
| RPS Growth (5Y CAGR) ⓘ | -1.14% | 6.02% |
| EPS Growth (5Y CAGR) ⓘ | -2.06% | -10.65% |
| BVPS Growth (5Y CAGR) ⓘ | -12.30% | 0.43% |
| Margin Growth (5Y Trend) ⓘ | -7.59% | -0.69% |
| FCF Growth (5Y CAGR) ⓘ | -12.19% | 5.40% |
| DPS Growth (5Y CAGR) ⓘ | 4.31% | 5.07% |
Quality (Business durability) | ||
| ROIC (Latest) ⓘ | N/A | 5.69% |
| ROE (Latest) ⓘ | 12.07% | 7.37% |
| ROA (Latest) ⓘ | 0.49% | 2.85% |
| ROIC (5Y Median) ⓘ | N/A | 4.26% |
| ROE (5Y Median) ⓘ | 11.54% | 6.04% |
| ROA (5Y Median) ⓘ | 0.37% | 2.45% |
| Net Debt / EBIT (Latest) ⓘ | 1.10 | 7.55 |
| Net Debt / EBIT (5Y Median) ⓘ | 2.00 | 8.26 |
| Net Debt / EBITDA (Latest) ⓘ | 1.03 | 5.26 |
| Net Debt / Assets ⓘ | 0.70% | 37.45% |
| EBITDA / Interest ⓘ | 2.90 | 4.11 |
| Operating Margin (Latest) ⓘ | 7.68% | 33.86% |
| Operating Margin (5Y Median) ⓘ | 5.66% | 37.49% |
| Debt to Equity (Latest) ⓘ | 65.29% | 88.76% |
| Profit Margin (Latest) ⓘ | N/A | 18.94% |
| Free Cash Flow (Latest) ⓘ | $10.97B | |
Momentum (Price trend) | ||
| 3Y Return ⓘ | -1.25% | +36.33% |
| 12M Return (excl. last month) ⓘ | -11.72% | +4.32% |
| 6M Return ⓘ | -9.68% | -1.74% |
| Price vs. 200-Day MA ⓘ | -7.21% | -1.42% |
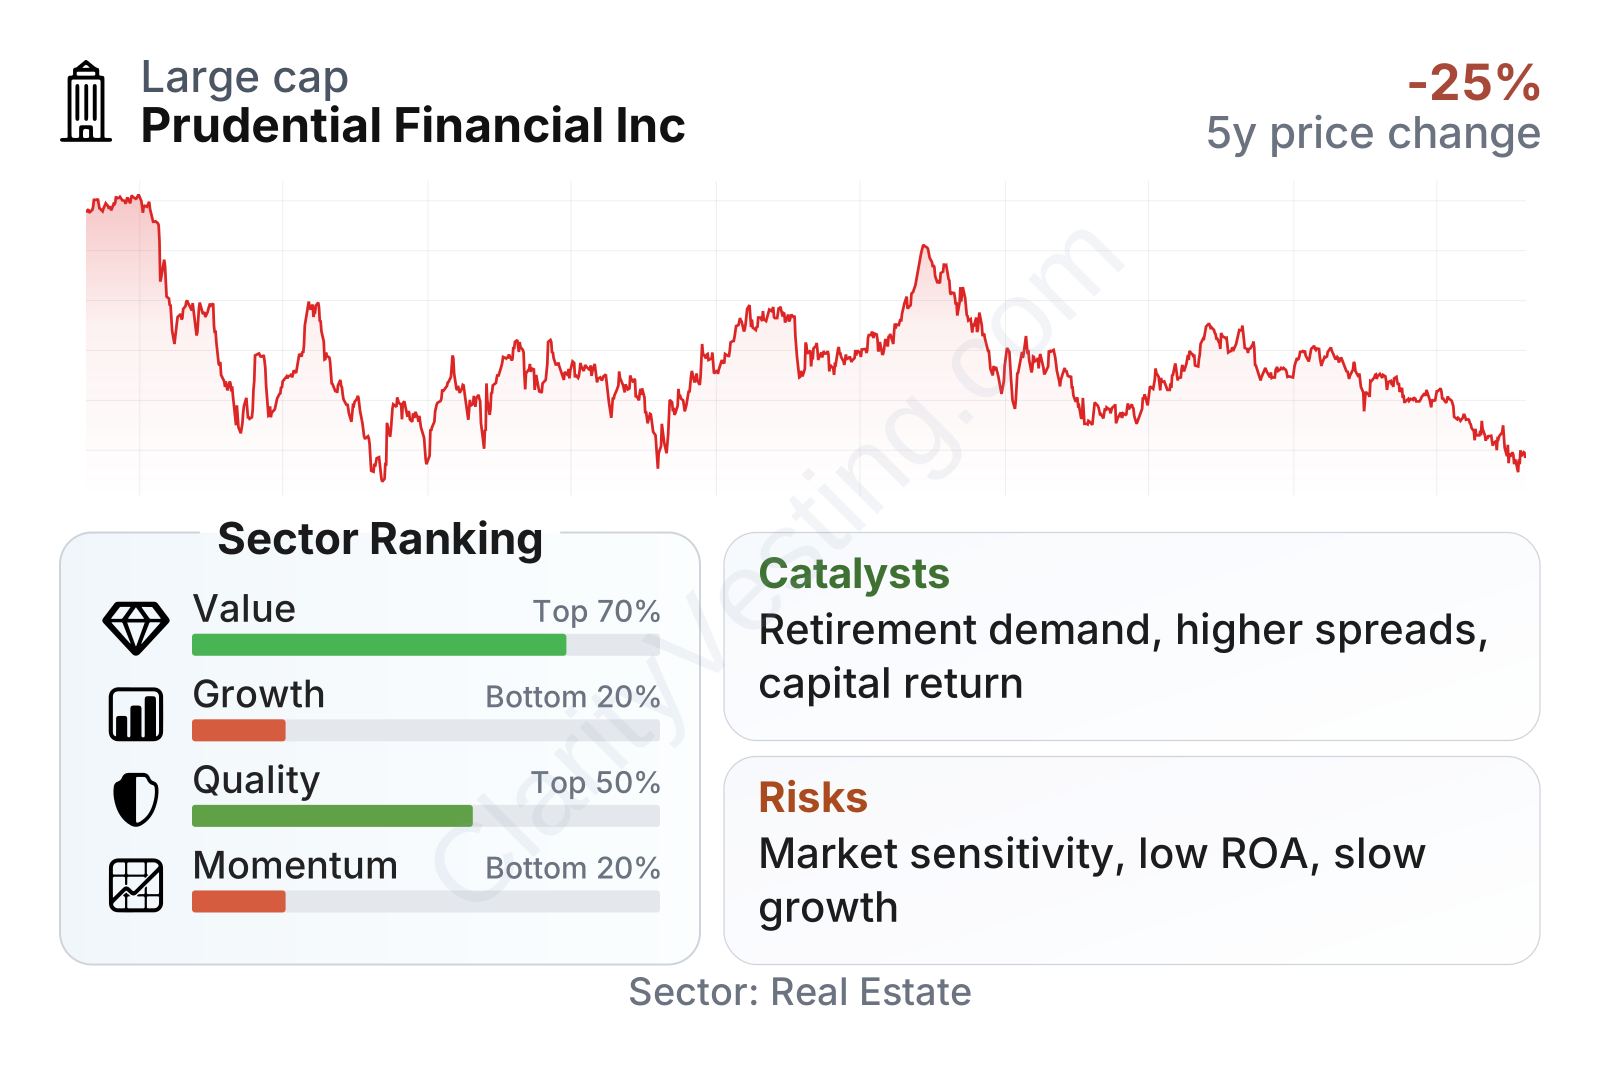
Prudential stands out as a very large financial company with a market value in the tens of billions of dollars, but the market has treated it cautiously. The share price has moved in a relatively narrow range over the past several years and remains well below the broader sector’s median momentum. In the factor summary, valuation looks unusually cheap, quality appears mixed but respectable, while growth and momentum rank weakly against the comparison group.
The most striking points are the very low price-to-book ratio, strong free cash flow generation, and a dividend yield far above what is common in the sector comparison. At the same time, revenue growth, revenue per share, and book value per share trends have been soft over a multi-year period. This combination usually signals that the market is giving credit for current cash generation but remains unconvinced about sustained expansion.
Growth
Prudential operates in a sector with durable long-term demand drivers. Aging populations, the shift from employer pensions to individual retirement planning, and the need for income protection and retirement income products all support the broader industry. In that sense, the company is active in a structurally relevant part of financial services rather than a fading niche.
Its strategy also has logic for future growth. Prudential has scale in retirement and insurance, a large investment platform, and a meaningful international presence. These businesses can reinforce one another: retirement and insurance products generate assets, those assets support fee income and investment income, and international markets can provide growth where U.S. markets are more mature. For a company like Prudential, growth is less about explosive sales gains and more about steady expansion in fee-bearing assets, underwriting discipline, spread management, and capital deployment.
Revenue per share has been inconsistent over the last five years. There was a clear rebound in 2024, followed by some pullback in 2025, leaving the broader trend roughly flat to slightly negative over the period. That does not describe a high-growth profile. Instead, it suggests a mature company whose progress depends on execution and market conditions rather than strong underlying volume growth alone.
One more constructive sign is the dividend path. Dividend per share has increased each year in the period shown, rising at a low- to mid-single-digit annual pace. That does not prove growth in the business by itself, but it does indicate management has had enough confidence in capital generation to keep lifting shareholder distributions.
Recent company updates have also emphasized capital return, cost discipline, retirement solutions, and product positioning around income and protection needs. For Prudential, the strongest catalyst is not a single breakthrough event but the possibility that higher-for-longer interest rates, stable credit conditions, and continued retirement product demand support better spreads and steadier earnings. If asset management flows and international operations improve at the same time, that could strengthen the growth profile from today’s subdued baseline.
Risks
This article is for informational purposes only and does not constitute financial advice. Some content is AI-generated. See Disclaimer


