Stock Analysis · Performance Food Group Co (PFGC)
Overview
Performance Food Group Co is a large U.S. food distributor. It buys food, beverages, and related products from manufacturers and delivers them to restaurants, schools, healthcare facilities, convenience stores, and other foodservice locations. In simple terms, it sits in the middle of the food supply chain: suppliers produce the goods, and Performance Food Group helps move them efficiently to the businesses that sell or serve them.
The company reports revenue through three main operating segments, with foodservice distribution clearly representing the largest part of the business. Based on recent annual reporting, the revenue mix is approximately:
- Foodservice – about 45% to 50%: distribution to independent restaurants, chain restaurants, schools, hospitals, hotels, and other institutional customers.
- Convenience – about 35% to 40%: products for convenience stores, including candy, snacks, beverages, cigarettes and tobacco products, foodservice items, and other fast-turn merchandise.
- Vistar – about 15% to 20%: distribution to vending operators, theaters, offices, schools, hospitality sites, and retail channels, with categories such as candy, snacks, beverages, frozen items, and packaging.
This structure gives the company exposure to both away-from-home eating and everyday convenience purchases. That matters because restaurant traffic can be cyclical, while convenience and institutional demand can provide some balance.
The business model is high-volume and low-margin. Revenue is very large, but profitability depends on efficient sourcing, warehouse operations, trucking, route density, and disciplined pricing. Over the last several years, sales have grown steadily, and gross profit has expanded, but the company still operates in a sector where even small cost pressures can affect earnings.
The flow of the business shows a familiar pattern for food distribution: most revenue is absorbed by product costs, leaving a relatively narrow profit pool after operating and interest expenses. A positive sign is that total revenue and gross profit have both moved higher over time, but the increase in interest expense has also become more noticeable.
Key Figures
| Metric | Value | Sector ⓘ |
|---|---|---|
| Date | Oct 17, 2026 | |
| Context | ||
| Sector | Consumer Defensive | |
| Industry | Food Distribution | |
| Market Cap ⓘ | $14.88B | |
| Beta ⓘ | 0.87 | |
Value (Cheapness) | ||
| P/E Ratio ⓘ | 41.36 | 17.88 |
| P/B Ratio ⓘ | 3.03 | 1.29 |
| FCF Yield ⓘ | 6.92% | 12.39% |
| Dividend Yield ⓘ | N/A | 2.85% |
| EBIT / EV ⓘ | 4.10% | 6.43% |
| PEG ⓘ | 0.76 | |
Growth (Business expansion) | ||
| Revenue Growth ⓘ | 7.30% | 4.10% |
| RPS Growth (5Y CAGR) ⓘ | 6.46% | 6.18% |
| EPS Growth (5Y CAGR) ⓘ | 15.24% | -13.59% |
| BVPS Growth (5Y CAGR) ⓘ | 9.37% | 3.20% |
| Margin Growth (5Y Trend) ⓘ | 0.64% | -0.15% |
| FCF Growth (5Y CAGR) ⓘ | 102.69% | 4.10% |
| DPS Growth (5Y CAGR) ⓘ | N/A | 6.79% |
Quality (Business durability) | ||
| ROIC (Latest) ⓘ | 6.67% | 12.34% |
| ROA (Latest) ⓘ | 1.93% | 6.30% |
| ROIC (5Y Median) ⓘ | 7.66% | 10.49% |
| ROA (5Y Median) ⓘ | 2.18% | 5.44% |
| Net Debt / EBIT (Latest) ⓘ | 8.55 | 1.96 |
| Net Debt / EBIT (5Y Median) ⓘ | 8.55 | 2.35 |
| Net Debt / EBITDA (Latest) ⓘ | 4.49 | 1.38 |
| Net Debt / Assets ⓘ | 40.80% | 21.51% |
| EBITDA / Interest ⓘ | 4.14 | 9.46 |
| Operating Margin (Latest) ⓘ | 1.33% | 8.87% |
| Operating Margin (5Y Median) ⓘ | 1.33% | 9.53% |
| Debt to Equity (Latest) ⓘ | 158.85% | 72.35% |
| Profit Margin (Latest) ⓘ | 0.56% | 5.40% |
| Free Cash Flow (Latest) ⓘ | $1.03B | |
Momentum (Price trend) | ||
| 3Y Return ⓘ | +76.41% | +20.92% |
| 12M Return (excl. last month) ⓘ | -11.28% | +2.13% |
| 6M Return ⓘ | +7.29% | +1.26% |
| Price vs. 200-Day MA ⓘ | -2.32% | +1.39% |
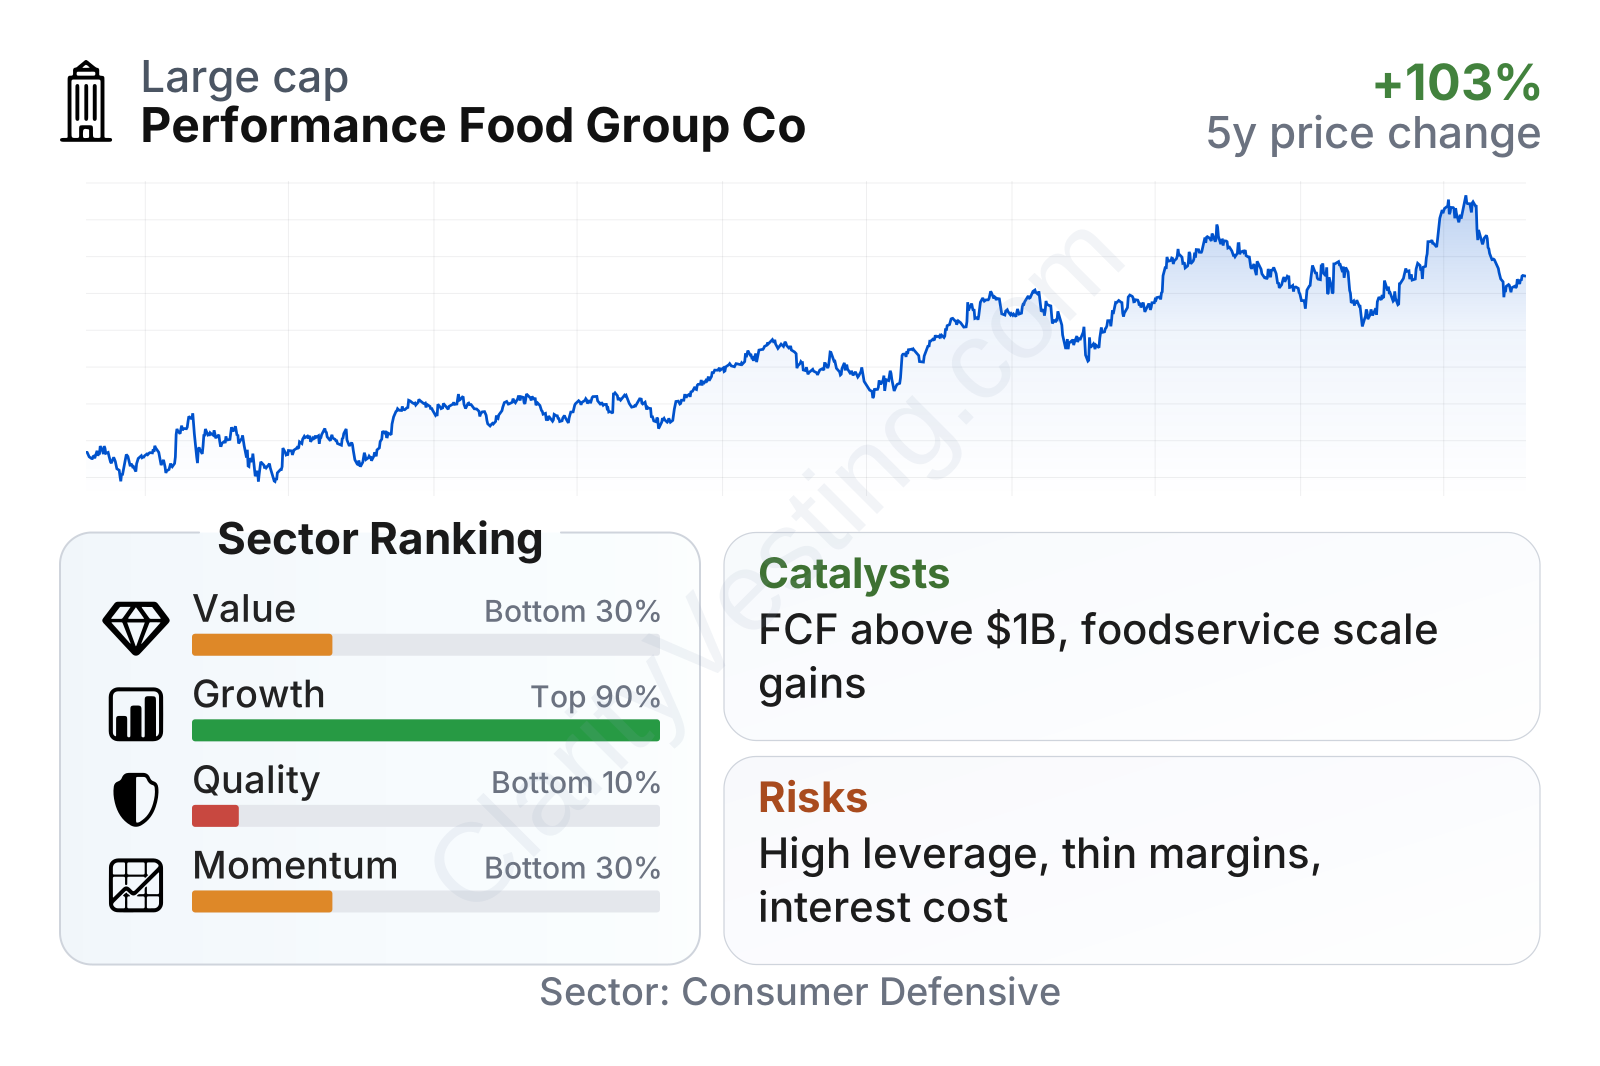
Performance Food Group is a large company within food distribution, with a stock that has delivered strong gains over the last three years even though shorter-term trading has been more uneven. The overall profile is mixed: growth ranks relatively well versus the sector, while quality and valuation metrics look weaker. In plain language, the market appears to be recognizing the company’s expansion, but it is also assigning a demanding price to a business with thin margins and above-average leverage.
The factor breakdown is especially important here. Growth indicators are generally ahead of the sector median, including revenue growth, earnings growth over five years, and a sharp rise in free cash flow. By contrast, profitability and balance sheet measures sit well below many sector peers. That combination often describes a company that is executing operationally but still carries financial constraints that limit flexibility.
Growth
Food distribution is not a flashy industry, but it is tied to long-term demand that tends to be durable. Restaurants, schools, hospitals, hotels, and convenience stores all need regular replenishment. In that sense, Performance Food Group operates in a steady sector with room to grow through market share gains, local expansion, acquisitions, and better use of its distribution network.
The company’s strategy is logical for this type of business. Scale matters because larger distributors can negotiate better with suppliers, spread logistics costs across more volume, and serve customers more efficiently. Performance Food Group has been growing by deepening its reach in foodservice while also maintaining a meaningful presence in convenience and specialty channels. That diversification helps reduce dependence on any single customer type.
Revenue growth has normalized from the unusually high post-pandemic rebound period, but it remains positive and has recently been running above the sector median. That is a constructive signal because it suggests the company is still finding ways to expand even after the easy recovery phase ended.
Free cash flow is one of the more encouraging parts of the picture. It has improved substantially over the last several years and recently moved above $1 billion on a trailing basis. For a distributor, that matters because stronger cash generation can support debt reduction, acquisitions, fleet and facility investment, and day-to-day operating resilience.
A meaningful catalyst is the ongoing shift toward scale in distribution. Smaller regional operators often face pressure from freight costs, labor inflation, and technology investment needs, while larger players can absorb those burdens more effectively. Performance Food Group also has room to improve returns if it can keep lifting gross profit and maintain operating discipline across its network.
Recent company communications have also highlighted continued sales growth, case volume trends in foodservice, and integration efforts tied to expansion initiatives. None of these changes alone transforms the business, but together they support the idea that the company is still in an active growth phase rather than a mature, stagnant one.
Risks
This article is for informational purposes only and does not constitute financial advice. Some content is AI-generated. See Disclaimer


