Stock Analysis · Principal Financial Group Inc (PFG)
Overview
Principal Financial Group is a large U.S. financial company focused on retirement, asset management, and insurance-related products. In simple terms, it helps employers run workplace retirement plans, helps individuals save and invest, manages money for institutional clients, and sells protection products such as life insurance and disability coverage. Its business is tied to long-term financial needs rather than short-cycle consumer spending, which gives it a recurring role in retirement savings and employee benefits.
The company reports results through several business segments. Based on recent annual reporting, the main economic drivers are spread across retirement and income solutions, global asset management, U.S. insurance and benefits, and international operations. Because financial companies often report both fees and spread-based income, exact economic weight can shift with markets and interest rates, but the broad mix can be summarized as follows:
- Retirement and Income Solutions — approximately 35% to 40%: workplace retirement plans, pension-related services, individual retirement products, and income solutions. This is a core franchise built around employers and long-term savings balances.
- Principal Asset Management — approximately 20% to 30%: investment management fees from institutions, intermediaries, retirement clients, and other investors across public and private assets.
- Benefits and Protection — approximately 20% to 25%: group insurance, specialty benefits, life, disability, and related employee-protection products, mostly tied to employer relationships.
- International businesses — approximately 10% to 20%: retirement, asset management, and insurance activities outside the U.S., with a meaningful presence in selected markets in Latin America and Asia.
That mix matters because it gives Principal more than one source of earnings. Fee income rises with assets under management and retirement balances, while insurance and spread businesses can benefit from underwriting discipline and interest income. The tradeoff is that results can look uneven from year to year because markets, claims, and investment conditions all affect reported profit.
The multi-year income flow shows that revenue recovered after a weak 2023, but profitability has been more volatile than revenue. Operating expenses have stayed fairly elevated, and net income has not moved in a straight line, which is typical for diversified financial firms but still important to keep in mind when judging consistency.
Key Figures
| Metric | Value | Sector ⓘ |
|---|---|---|
| Date | Oct 17, 2026 | |
| Context | ||
| Sector | Financial Services | |
| Industry | Asset Management | |
| Market Cap ⓘ | $22.96B | |
| Beta ⓘ | 0.87 | |
Value (Cheapness) | ||
| P/E Ratio ⓘ | 15.32 | 12.26 |
| P/B Ratio ⓘ | 2.09 | 1.23 |
| FCF Yield ⓘ | 21.13% | 10.40% |
| Dividend Yield ⓘ | 2.96% | 3.02% |
| EBIT / EV ⓘ | 8.13% | 8.14% |
| PEG ⓘ | 1.06 | |
Growth (Business expansion) | ||
| Revenue Growth ⓘ | 6.40% | 9.35% |
| RPS Growth (5Y CAGR) ⓘ | 6.97% | 12.19% |
| EPS Growth (5Y CAGR) ⓘ | -9.60% | -9.53% |
| BVPS Growth (5Y CAGR) ⓘ | -3.73% | 4.99% |
| Margin Growth (5Y Trend) ⓘ | -4.17% | -3.86% |
| FCF Growth (5Y CAGR) ⓘ | 9.49% | 4.81% |
| DPS Growth (5Y CAGR) ⓘ | 6.04% | 8.79% |
Quality (Business durability) | ||
| ROIC (Latest) ⓘ | 10.29% | 9.49% |
| ROE (Latest) ⓘ | 13.69% | 13.90% |
| ROA (Latest) ⓘ | 0.45% | 1.55% |
| ROIC (5Y Median) ⓘ | 8.78% | 7.86% |
| ROE (5Y Median) ⓘ | 10.73% | 12.17% |
| ROA (5Y Median) ⓘ | 0.51% | 1.30% |
| Net Debt / EBIT (Latest) ⓘ | -0.48 | 0.96 |
| Net Debt / EBIT (5Y Median) ⓘ | -0.13 | 0.73 |
| Net Debt / EBITDA (Latest) ⓘ | -0.34 | 0.92 |
| Operating Margin (Latest) ⓘ | 12.13% | 22.30% |
| Operating Margin (5Y Median) ⓘ | 11.72% | 24.63% |
| Debt to Equity (Latest) ⓘ | 35.75% | 58.56% |
| Profit Margin (Latest) ⓘ | 9.93% | 26.57% |
| Free Cash Flow (Latest) ⓘ | $4.85B | |
Momentum (Price trend) | ||
| 3Y Return ⓘ | +70.20% | +88.33% |
| 12M Return (excl. last month) ⓘ | +47.62% | +19.38% |
| 6M Return ⓘ | +16.88% | +4.75% |
| Price vs. 200-Day MA ⓘ | +7.61% | +3.50% |
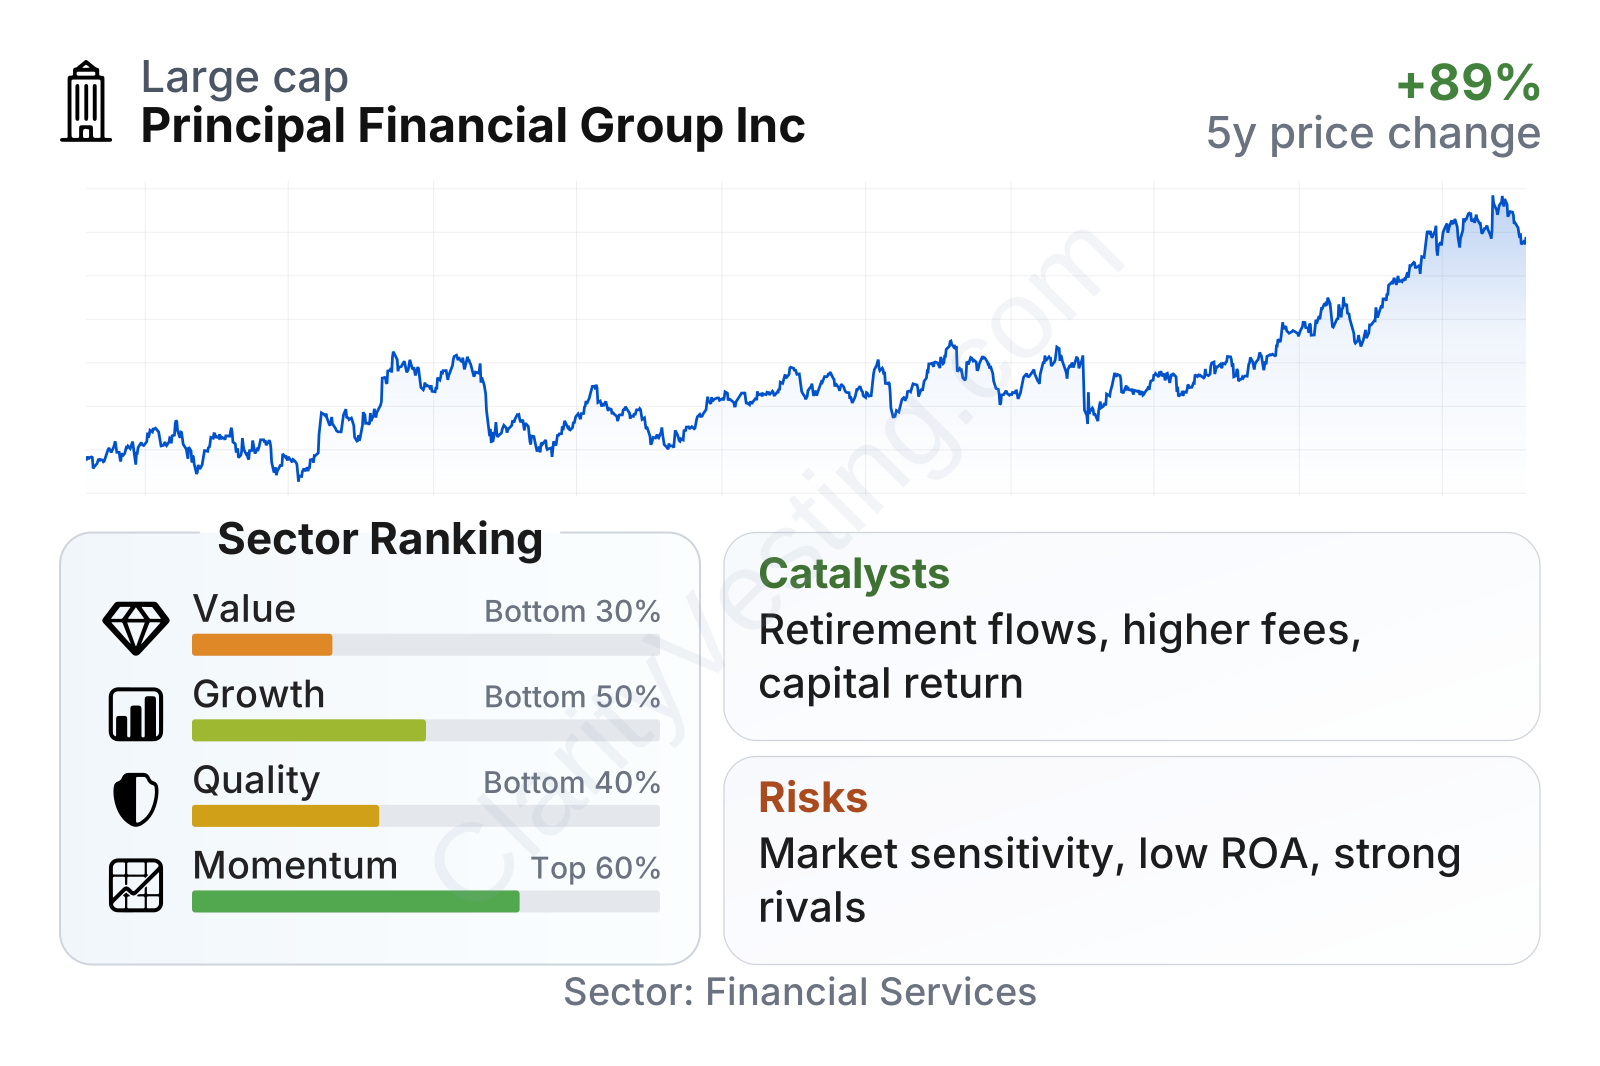
Principal is a large-cap financial company with a market value in the tens of billions of dollars and a stock volatility level slightly below the broader market. The overall factor profile looks mixed. Recent share-price momentum has been strong, with the stock outperforming much of the financial sector over the last 6 to 12 months. By contrast, the value profile looks less favorable because the stock trades above sector median levels on both earnings and book value multiples. Quality and growth sit closer to the middle-to-lower part of the sector, reflecting decent capital strength and cash generation, but more modest profitability and slower long-term expansion than many peers.
Growth
Principal operates in areas with durable long-term demand. Retirement saving, workplace benefits, and professional asset management are supported by aging populations, the ongoing shift of retirement responsibility toward individuals, and employers’ need to offer savings and protection benefits. Those are favorable industry tailwinds, even if they do not produce rapid growth every year.
The company’s strategy is logical for this environment. It already has established relationships with employers, retirement plan participants, institutional clients, and financial intermediaries. That allows Principal to cross-sell services: a company using retirement-plan administration may also use employee benefits products, while retirement assets can support related investment-management fees. This kind of ecosystem can create steady asset gathering over time without relying on one product line alone.
A second support for future growth is interest-rate sensitivity. Compared with a pure asset manager, Principal has insurance and spread-based businesses that can benefit from higher reinvestment yields, provided claims and credit experience remain controlled. At the same time, a stronger stock and bond market backdrop tends to lift fee revenue by increasing client asset balances. In a constructive market environment, both sides of the business can improve together.
Earnings per share have not been perfectly smooth, but they have improved from the softer period seen earlier in the cycle. That pattern suggests the company retains earnings power even after market disruptions, though not with the clean consistency of the very best firms in the sector.
Book value per share dropped sharply during the 2022 market shock and has been rebuilding since then. The rebound is important for an insurer and asset manager because book value reflects the balance-sheet base supporting future business. Even so, the five-year trend is still not especially strong, which helps explain why the market remains selective about assigning a premium.
Recent company communications in 2026 have continued to emphasize capital return, disciplined expense management, and growth in retirement and asset-management capabilities. None of those items is transformational on its own, but together they support a credible case for gradual expansion rather than dramatic acceleration.
Risks
This article is for informational purposes only and does not constitute financial advice. Some content is AI-generated. See Disclaimer


