Stock Analysis · Preferred Bank (PFBC)
Overview
Preferred Bank is a California-based regional bank focused mainly on commercial banking. It serves small and mid-sized businesses, entrepreneurs, commercial real estate customers, and high-net-worth individuals, with a strong presence in Southern California, New York, Texas, and the San Francisco Bay Area. The bank is especially known for lending to businesses in the Asian-American commercial community, although its customer base is broader than that niche alone.
Like most banks, Preferred Bank does not make money by selling physical products. Its core business is taking deposits and turning those funds into loans and other interest-earning assets. The difference between what it earns on loans and securities and what it pays on deposits and borrowings is the main engine of profit. Based on recent annual filings, revenue is primarily tied to interest income, while non-interest income remains a much smaller part of the business.
The main revenue sources can be summarized as follows:
- Net interest income: approximately 85% to 92% of total revenue in recent years. This includes interest earned on commercial real estate loans, commercial and industrial loans, construction loans, residential mortgage loans, and investment securities, minus interest paid on deposits and borrowings.
- Non-interest income: approximately 8% to 15% of total revenue. This generally includes service charges, loan fees, gains on loan sales, wealth-related fees, and other banking service income.
That revenue mix matters because it makes Preferred Bank a relatively straightforward business to understand: profitability depends mostly on loan growth, deposit costs, credit quality, and interest rates. Over the last several years, total revenue has expanded strongly, but earnings have been more uneven as funding costs rose across the banking industry. Operating expenses have remained fairly controlled relative to revenue, which has helped preserve profitability.
The long-term trend shows a bank that has grown revenue materially since 2021, with expenses rising much more slowly than revenue for most of the period. The main pressure point has been funding cost: interest expense climbed sharply during the higher-rate cycle, which limited how much of that revenue growth turned into bottom-line expansion.
Key Figures
| Metric | Value | Sector ⓘ |
|---|---|---|
| Date | Oct 17, 2026 | |
| Context | ||
| Sector | Financial Services | |
| Industry | Banks - Regional | |
| Market Cap ⓘ | $1.21B | |
| Beta ⓘ | 0.56 | |
Value (Cheapness) | ||
| P/E Ratio ⓘ | 9.51 | 12.26 |
| P/B Ratio ⓘ | 1.57 | 1.23 |
| FCF Yield ⓘ | 13.89% | 10.40% |
| Dividend Yield ⓘ | 3.07% | 3.02% |
| EBIT / EV ⓘ | N/A | 8.14% |
| PEG ⓘ | 0.94 | |
Growth (Business expansion) | ||
| Revenue Growth ⓘ | 4.70% | 9.35% |
| RPS Growth (5Y CAGR) ⓘ | 27.49% | 12.19% |
| EPS Growth (5Y CAGR) ⓘ | -12.40% | -9.53% |
| BVPS Growth (5Y CAGR) ⓘ | 11.73% | 4.99% |
| Margin Growth (5Y Trend) ⓘ | -23.19% | -3.86% |
| FCF Growth (5Y CAGR) ⓘ | 8.80% | 4.81% |
| DPS Growth (5Y CAGR) ⓘ | 19.91% | 8.79% |
Quality (Business durability) | ||
| ROIC (Latest) ⓘ | N/A | 9.49% |
| ROE (Latest) ⓘ | 17.26% | 13.90% |
| ROA (Latest) ⓘ | 1.78% | 1.55% |
| ROIC (5Y Median) ⓘ | 14.89% | 7.86% |
| ROE (5Y Median) ⓘ | 17.92% | 12.17% |
| ROA (5Y Median) ⓘ | 1.92% | 1.30% |
| Net Debt / EBIT (Latest) ⓘ | N/A | 0.96 |
| Net Debt / EBIT (5Y Median) ⓘ | -3.26 | 0.73 |
| Net Debt / EBITDA (Latest) ⓘ | -1.87 | 0.92 |
| Operating Margin (Latest) ⓘ | N/A | 22.30% |
| Operating Margin (5Y Median) ⓘ | 43.56% | 24.63% |
| Debt to Equity (Latest) ⓘ | 48.54% | 58.56% |
| Profit Margin (Latest) ⓘ | 47.25% | 26.57% |
| Free Cash Flow (Latest) ⓘ | $167.90M | |
Momentum (Price trend) | ||
| 3Y Return ⓘ | +84.44% | +88.33% |
| 12M Return (excl. last month) ⓘ | +17.30% | +19.38% |
| 6M Return ⓘ | +11.47% | +4.75% |
| Price vs. 200-Day MA ⓘ | +7.49% | +3.50% |
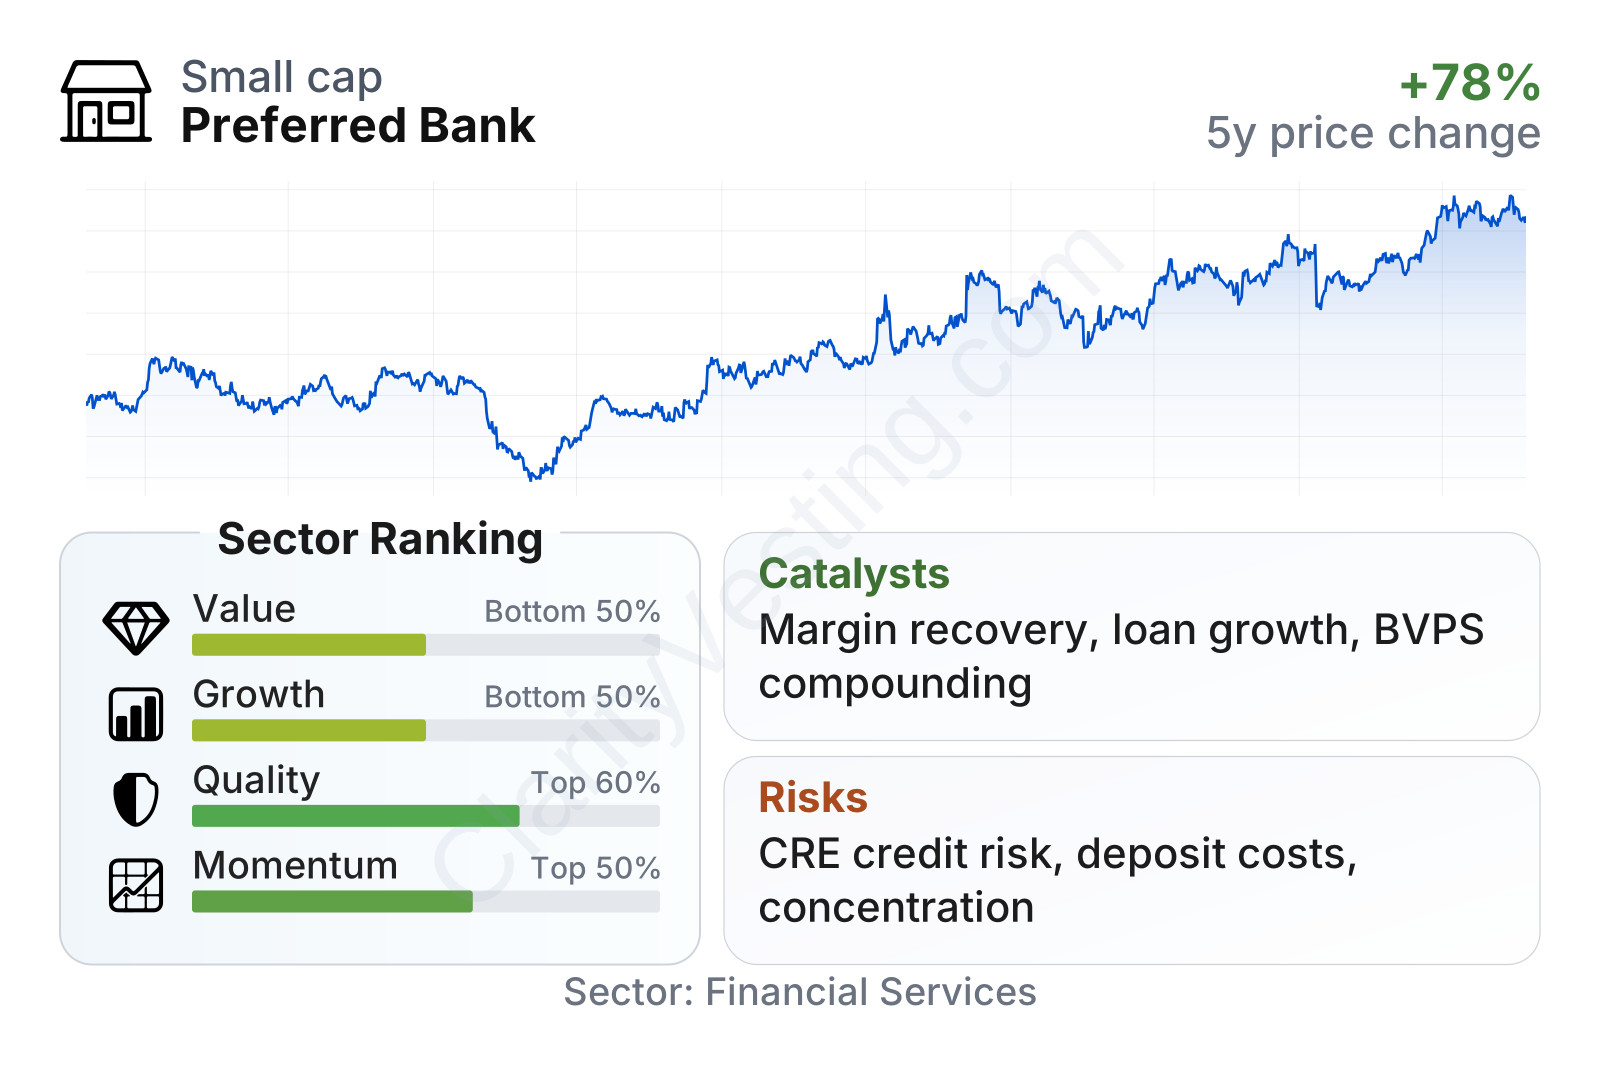
Preferred Bank is a small-cap regional bank with relatively low share-price volatility, as shown by its beta well below 1. On valuation, the stock trades at a lower earnings multiple than the sector median, but at a higher price-to-book multiple. That mixed picture suggests the market is recognizing the bank’s profitability and balance-sheet quality, while not treating it as a deep discount name.
Quality metrics are one of the stronger parts of the profile. Return on equity and return on assets are both above the sector median, and profit margin is also notably stronger than many peers. Growth signals are more uneven: recent year-over-year revenue growth has been modest compared with the sector, but longer-term growth in revenue per share, book value per share, free cash flow, and dividends has been solid.
Price performance has also been constructive. The stock experienced the regional bank selloff in 2023, then recovered and moved to new highs by 2026. That pattern suggests the market has gradually regained confidence in the bank’s earnings power and balance-sheet resilience.
Growth
Preferred Bank operates in regional banking, which is not a high-growth industry in the same way as software or semiconductors. It is a mature sector, but it can still produce attractive long-term expansion when a bank has a disciplined lending culture, strong deposit relationships, and room to gain share in attractive local markets. Preferred Bank’s footprint gives it exposure to large business communities in California and selected urban markets outside the state, which can support continued growth if credit underwriting remains sound.
The company’s strategy is logical for this type of business. It focuses on relationship banking rather than a mass-market national model, and it has historically emphasized commercial customers that can generate both lending volume and deposit balances. That can be an advantage because business banking relationships are often stickier and more profitable than purely retail accounts. The bank has also grown book value per share at a healthy pace over the past five years, which points to steady value creation inside the franchise.
Earnings per share climbed sharply from 2021 through 2023, then eased in 2024 before improving again in 2025. That pattern fits what happened across banking: loan yields improved, but deposit and funding costs also rose. The important point is that earnings remained strong rather than collapsing, showing that the bank was able to absorb a much tougher rate environment better than many weaker peers.
Book value per share has moved upward year after year, which is important for a bank because it reflects the capital base supporting future lending and loss absorption. The pace of growth has been stronger than the sector median over five years, suggesting the bank has compounded shareholder equity effectively even through a more volatile period for the industry.
A key catalyst is the possibility of improved net interest margin if funding pressures continue to normalize. If deposit costs stabilize while loan yields remain relatively healthy, earnings could benefit without requiring unusually aggressive balance-sheet growth. Another catalyst is continued expansion in commercial lending and treasury relationships in its target markets, especially if management can deepen ties with existing business customers rather than relying only on new account acquisition.
Recent company communications in 2026 have continued to emphasize capital strength, liquidity, and disciplined loan production rather than dramatic strategic shifts. That is not flashy, but for a bank it can be meaningful: durable long-term growth often comes from consistency, not rapid transformation.
Risks
This article is for informational purposes only and does not constitute financial advice. Some content is AI-generated. See Disclaimer


