Stock Analysis · PepsiCo Inc (PEP)
Overview
PepsiCo is one of the world’s largest packaged food and beverage companies. It sells carbonated soft drinks, sports drinks, water, juice, ready-to-drink coffee and tea, as well as salty snacks, tortilla chips, and other convenient foods. Unlike many beverage-focused rivals, PepsiCo combines drinks and snacks under the same corporate structure, which gives it broad shelf presence in supermarkets, convenience stores, restaurants, vending, and e-commerce.
The business is organized by geography and product groups. Based on recent annual reporting, revenue is spread across a mix of snacks and beverages, with food now representing a slightly larger share than drinks. Approximate revenue contribution by division is as follows:
- Frito-Lay North America: about 29% of revenue. This includes brands such as Lay’s, Doritos, Cheetos, Ruffles, Tostitos, and related snack products.
- PepsiCo Beverages North America: about 28%. This includes Pepsi, Mountain Dew, Gatorade, bubly, LIFEWTR, ready-to-drink coffee partnerships, and other beverage brands in the U.S. and Canada.
- Europe: about 16%. This segment includes both food and beverage operations across European markets.
- Africa, Middle East and South Asia: about 10%. This includes snacks and drinks sold across a wide group of developing markets.
- Latin America: about 9%. This covers regional snack and beverage operations.
- Asia Pacific, Australia, New Zealand and China Region: about 8%. This includes a mix of local and global brands in beverages and convenient foods.
Looking at the broader mix, convenient foods account for roughly 58% of revenue and beverages for about 42%. That matters because snacks often carry attractive margins and can balance slower periods in beverages. Over the last several years, total revenue has moved from roughly $79 billion to around $94 billion, while gross profit has also expanded, showing that PepsiCo has continued to grow even in a tougher cost environment. At the same time, selling and administrative costs have risen materially, which helps explain why recent earnings growth has not always matched sales growth one-for-one.
The long-term pattern is a larger business with improving gross profit, but also with heavier commercial spending. That combination fits a company defending brand strength while still pushing for growth across many markets.
Key Figures
| Metric | Value | Sector ⓘ |
|---|---|---|
| Date | Oct 17, 2026 | |
| Context | ||
| Sector | Consumer Defensive | |
| Industry | Beverages - Non-Alcoholic | |
| Market Cap ⓘ | $172.63B | |
| Beta ⓘ | 0.36 | |
Value (Cheapness) | ||
| P/E Ratio ⓘ | 16.02 | 17.88 |
| P/B Ratio ⓘ | 7.81 | 1.29 |
| FCF Yield ⓘ | 6.07% | 12.39% |
| Dividend Yield ⓘ | 4.61% | 2.85% |
| EBIT / EV ⓘ | 6.46% | 6.43% |
| PEG ⓘ | 1.38 | |
Growth (Business expansion) | ||
| Revenue Growth ⓘ | 5.60% | 4.10% |
| RPS Growth (5Y CAGR) ⓘ | 4.57% | 6.18% |
| EPS Growth (5Y CAGR) ⓘ | -2.61% | -13.59% |
| BVPS Growth (5Y CAGR) ⓘ | 6.32% | 3.20% |
| Margin Growth (5Y Trend) ⓘ | -2.60% | -0.15% |
| FCF Growth (5Y CAGR) ⓘ | 2.35% | 4.10% |
| DPS Growth (5Y CAGR) ⓘ | 7.37% | 6.79% |
Quality (Business durability) | ||
| ROIC (Latest) ⓘ | 15.80% | 12.34% |
| ROA (Latest) ⓘ | 9.96% | 6.30% |
| ROIC (5Y Median) ⓘ | 16.51% | 10.49% |
| ROA (5Y Median) ⓘ | 9.42% | 5.44% |
| Net Debt / EBIT (Latest) ⓘ | 2.82 | 1.96 |
| Net Debt / EBIT (5Y Median) ⓘ | 2.93 | 2.35 |
| Net Debt / EBITDA (Latest) ⓘ | 2.17 | 1.38 |
| Net Debt / Assets ⓘ | 36.80% | 21.51% |
| EBITDA / Interest ⓘ | 17.47 | 9.46 |
| Operating Margin (Latest) ⓘ | 14.85% | 8.87% |
| Operating Margin (5Y Median) ⓘ | 13.48% | 9.53% |
| Debt to Equity (Latest) ⓘ | 232.73% | 72.35% |
| Profit Margin (Latest) ⓘ | 11.09% | 5.40% |
| Free Cash Flow (Latest) ⓘ | $10.47B | |
Momentum (Price trend) | ||
| 3Y Return ⓘ | -11.34% | +20.92% |
| 12M Return (excl. last month) ⓘ | -1.17% | +2.13% |
| 6M Return ⓘ | -16.59% | +1.26% |
| Price vs. 200-Day MA ⓘ | -11.57% | +1.39% |
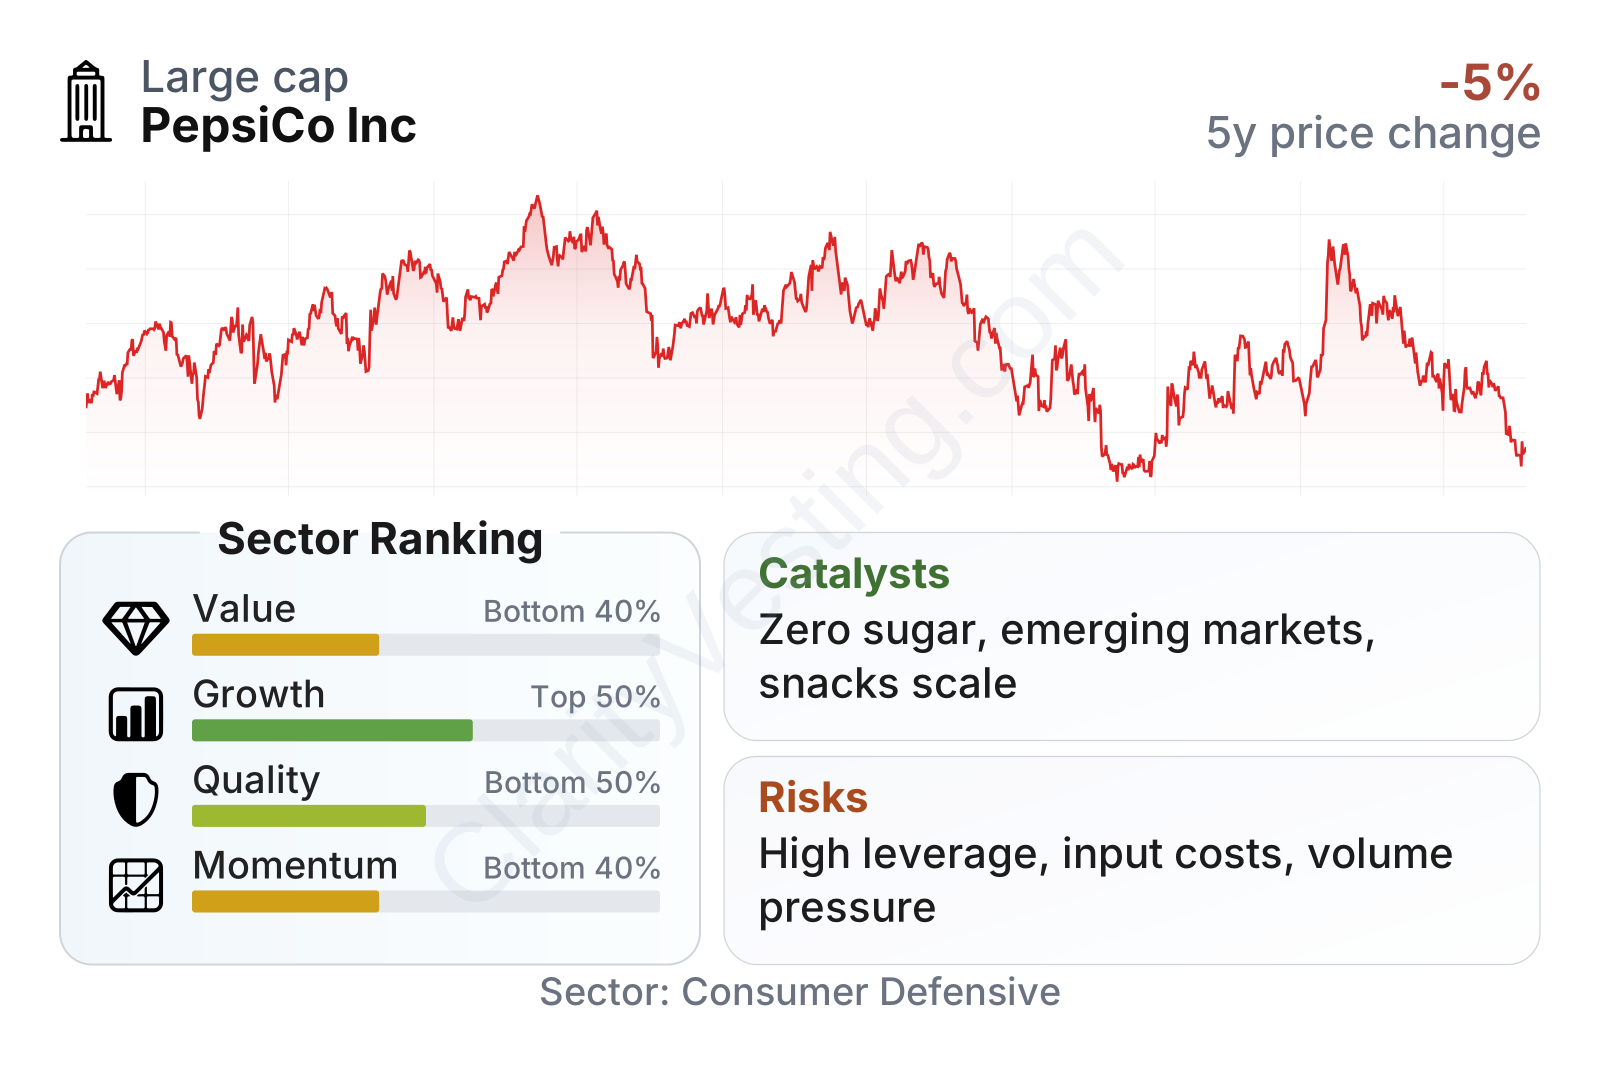
PepsiCo is a very large consumer staples company with unusually low share-price volatility, as reflected by a beta well below 1.0. In the factor breakdown, growth ranks around the middle of the sector, while quality and momentum sit in the lower half. That does not mean the business is weak; it mainly reflects two things visible elsewhere in the numbers: leverage is high, and the stock has lagged the sector recently. Profitability itself remains strong, with returns on capital, operating margin, and profit margin all ahead of sector medians. The value picture is mixed, with a below-sector P/E but a high price-to-book ratio, which is common for brand-heavy businesses with substantial intangible value and shareholder returns.
Growth
PepsiCo operates in a mature but resilient sector rather than a fast-expanding one. Packaged snacks and non-alcoholic beverages usually do not deliver explosive demand growth, but they tend to offer steadier consumption through economic cycles. That makes future growth more dependent on pricing power, product mix, international expansion, convenience channels, and premium or functional categories such as zero-sugar drinks, sports hydration, and better-for-you snacks.
PepsiCo’s strategy still makes sense for long-term expansion. Its portfolio is broad, distribution is global, and management has spent years building across multiple consumption occasions rather than relying on one flagship soda brand. The combination of snacks and beverages is especially important: it strengthens negotiating power with retailers, supports joint promotions, and helps the company capture more shelf space than a narrower rival could.
Revenue growth has cooled from the stronger post-inflation and pricing-driven years, but the business is still showing pockets of positive year-over-year expansion. The pattern suggests a company moving from exceptional pricing-led growth back toward a more normal pace. That is a healthier interpretation than a sharp structural decline, although it also means future growth may depend more on volume recovery and mix improvement than on repeated price increases.
Cash generation remains one of the more appealing parts of the profile. Free cash flow has rebounded from earlier softer levels and recently moved into the high single-digit billions on a trailing basis, while the latest profitability readings remain solid. PepsiCo has also continued to grow its dividend per share over the last five years at a pace slightly ahead of the sector median, which points to durable underlying cash production even if earnings growth has not been perfectly smooth.
A meaningful catalyst is ongoing portfolio evolution. PepsiCo has been investing in zero-sugar beverages, sports hydration, international snacks, and multicultural or local brands that can travel across markets. Another potential opportunity comes from execution in emerging markets, where rising urbanization and modern retail can lift demand for branded convenience foods and drinks over time. In a mature industry, these incremental gains matter more than dramatic one-off breakthroughs.
Risks
This article is for informational purposes only and does not constitute financial advice. Some content is AI-generated. See Disclaimer


